1. Introduction
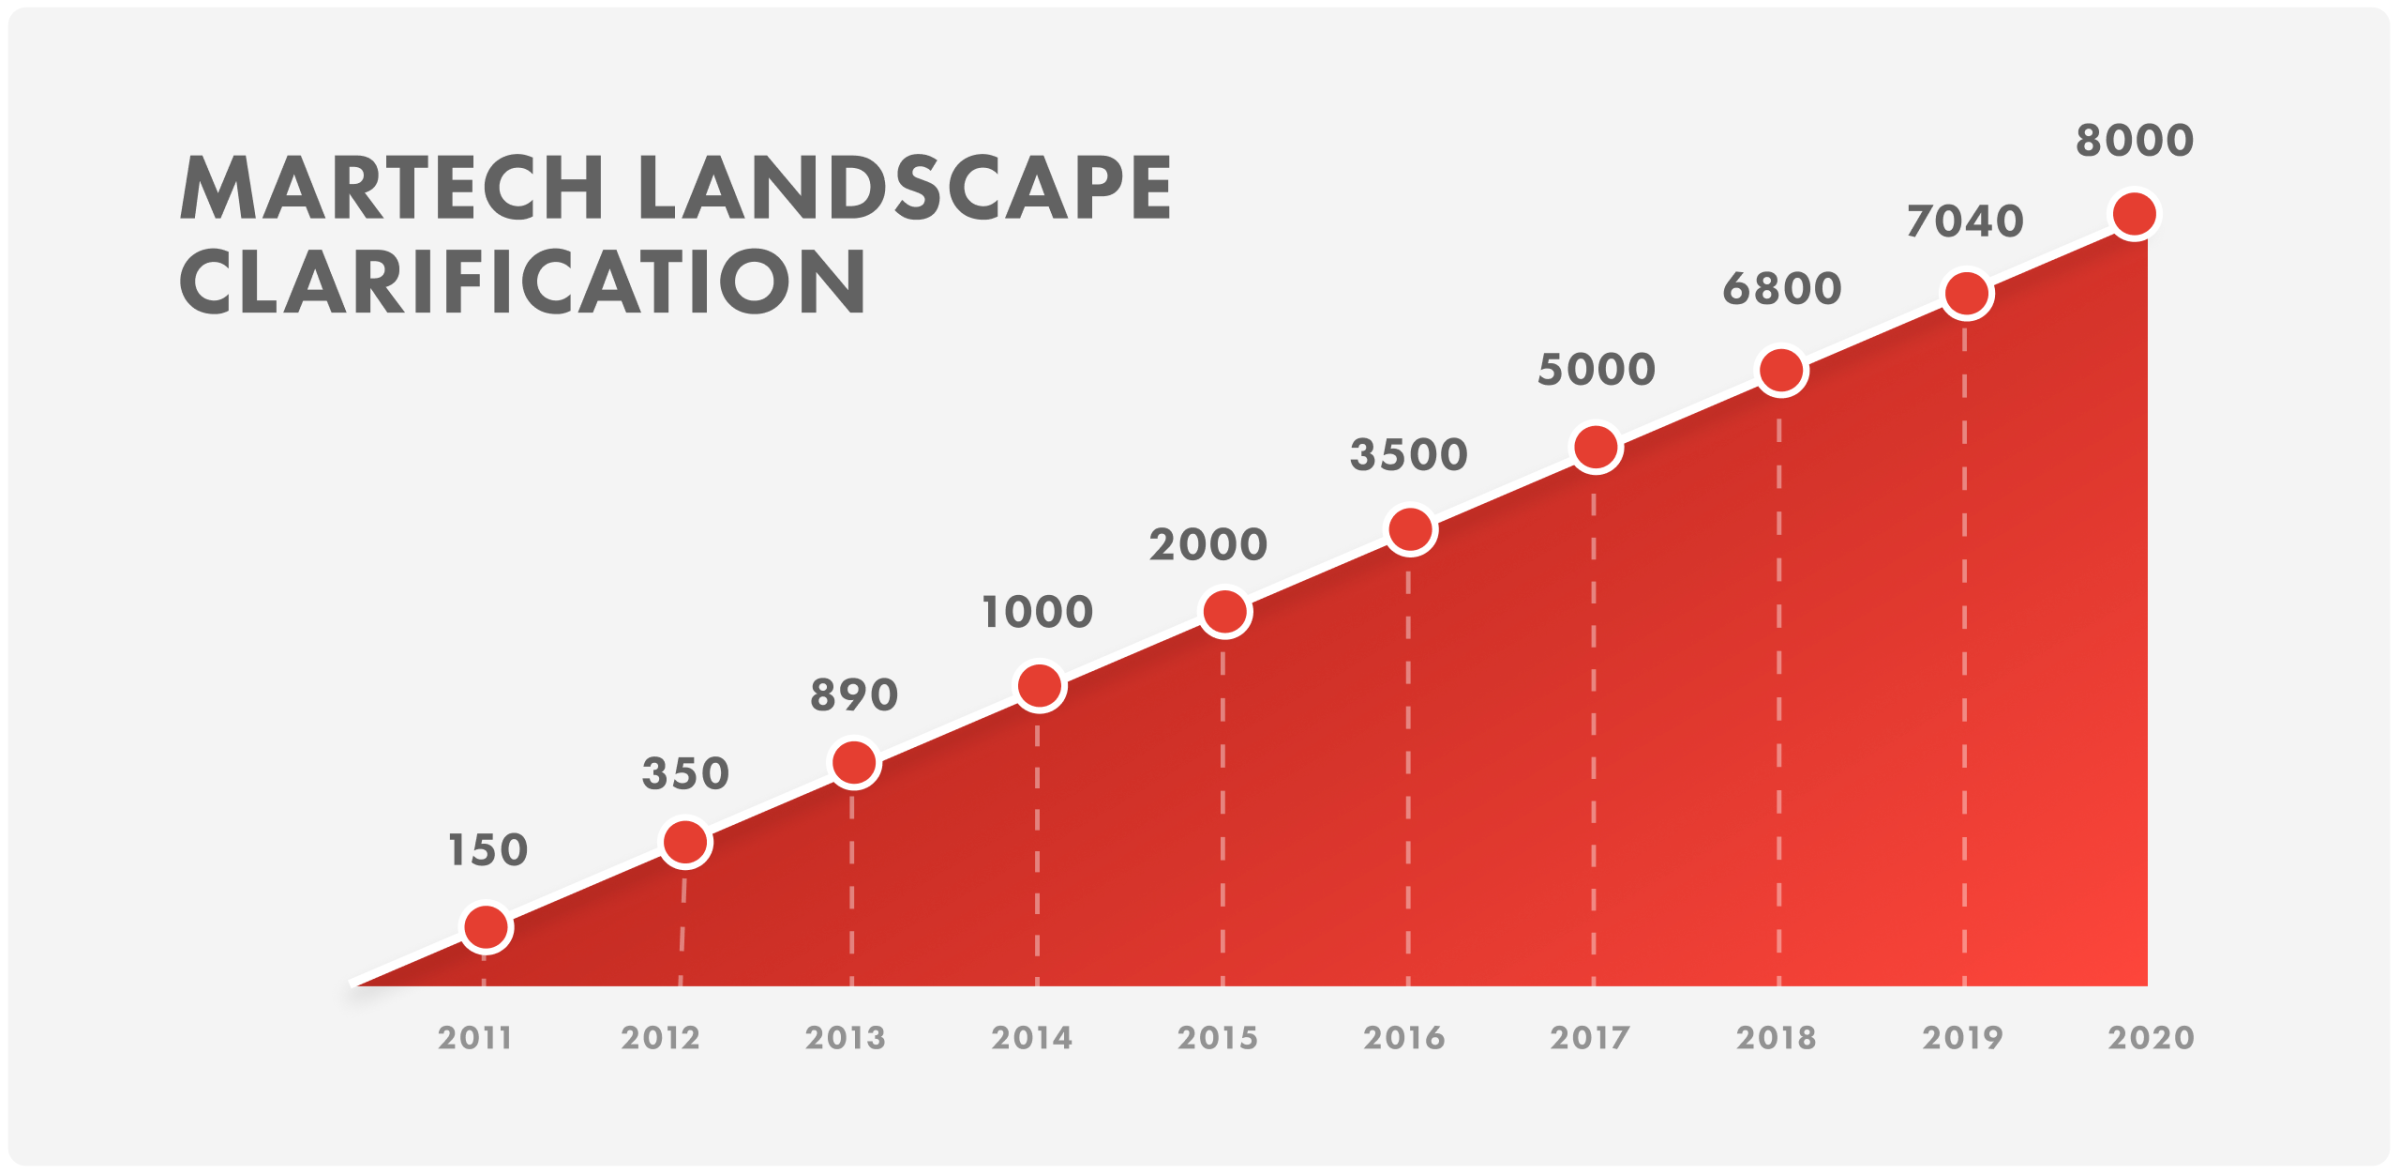
In collaboration with SimilarWeb, we spent two and a half months working with data scientists to analyse and identify trends in the MarTech landscape as created by Scott Brinker. As is evident from the graph, the growth in the number of MarTech websites alone has been steep and steady. As of 2020 there were 8K MarTech websites, quadrupling the number from only 5 years before.
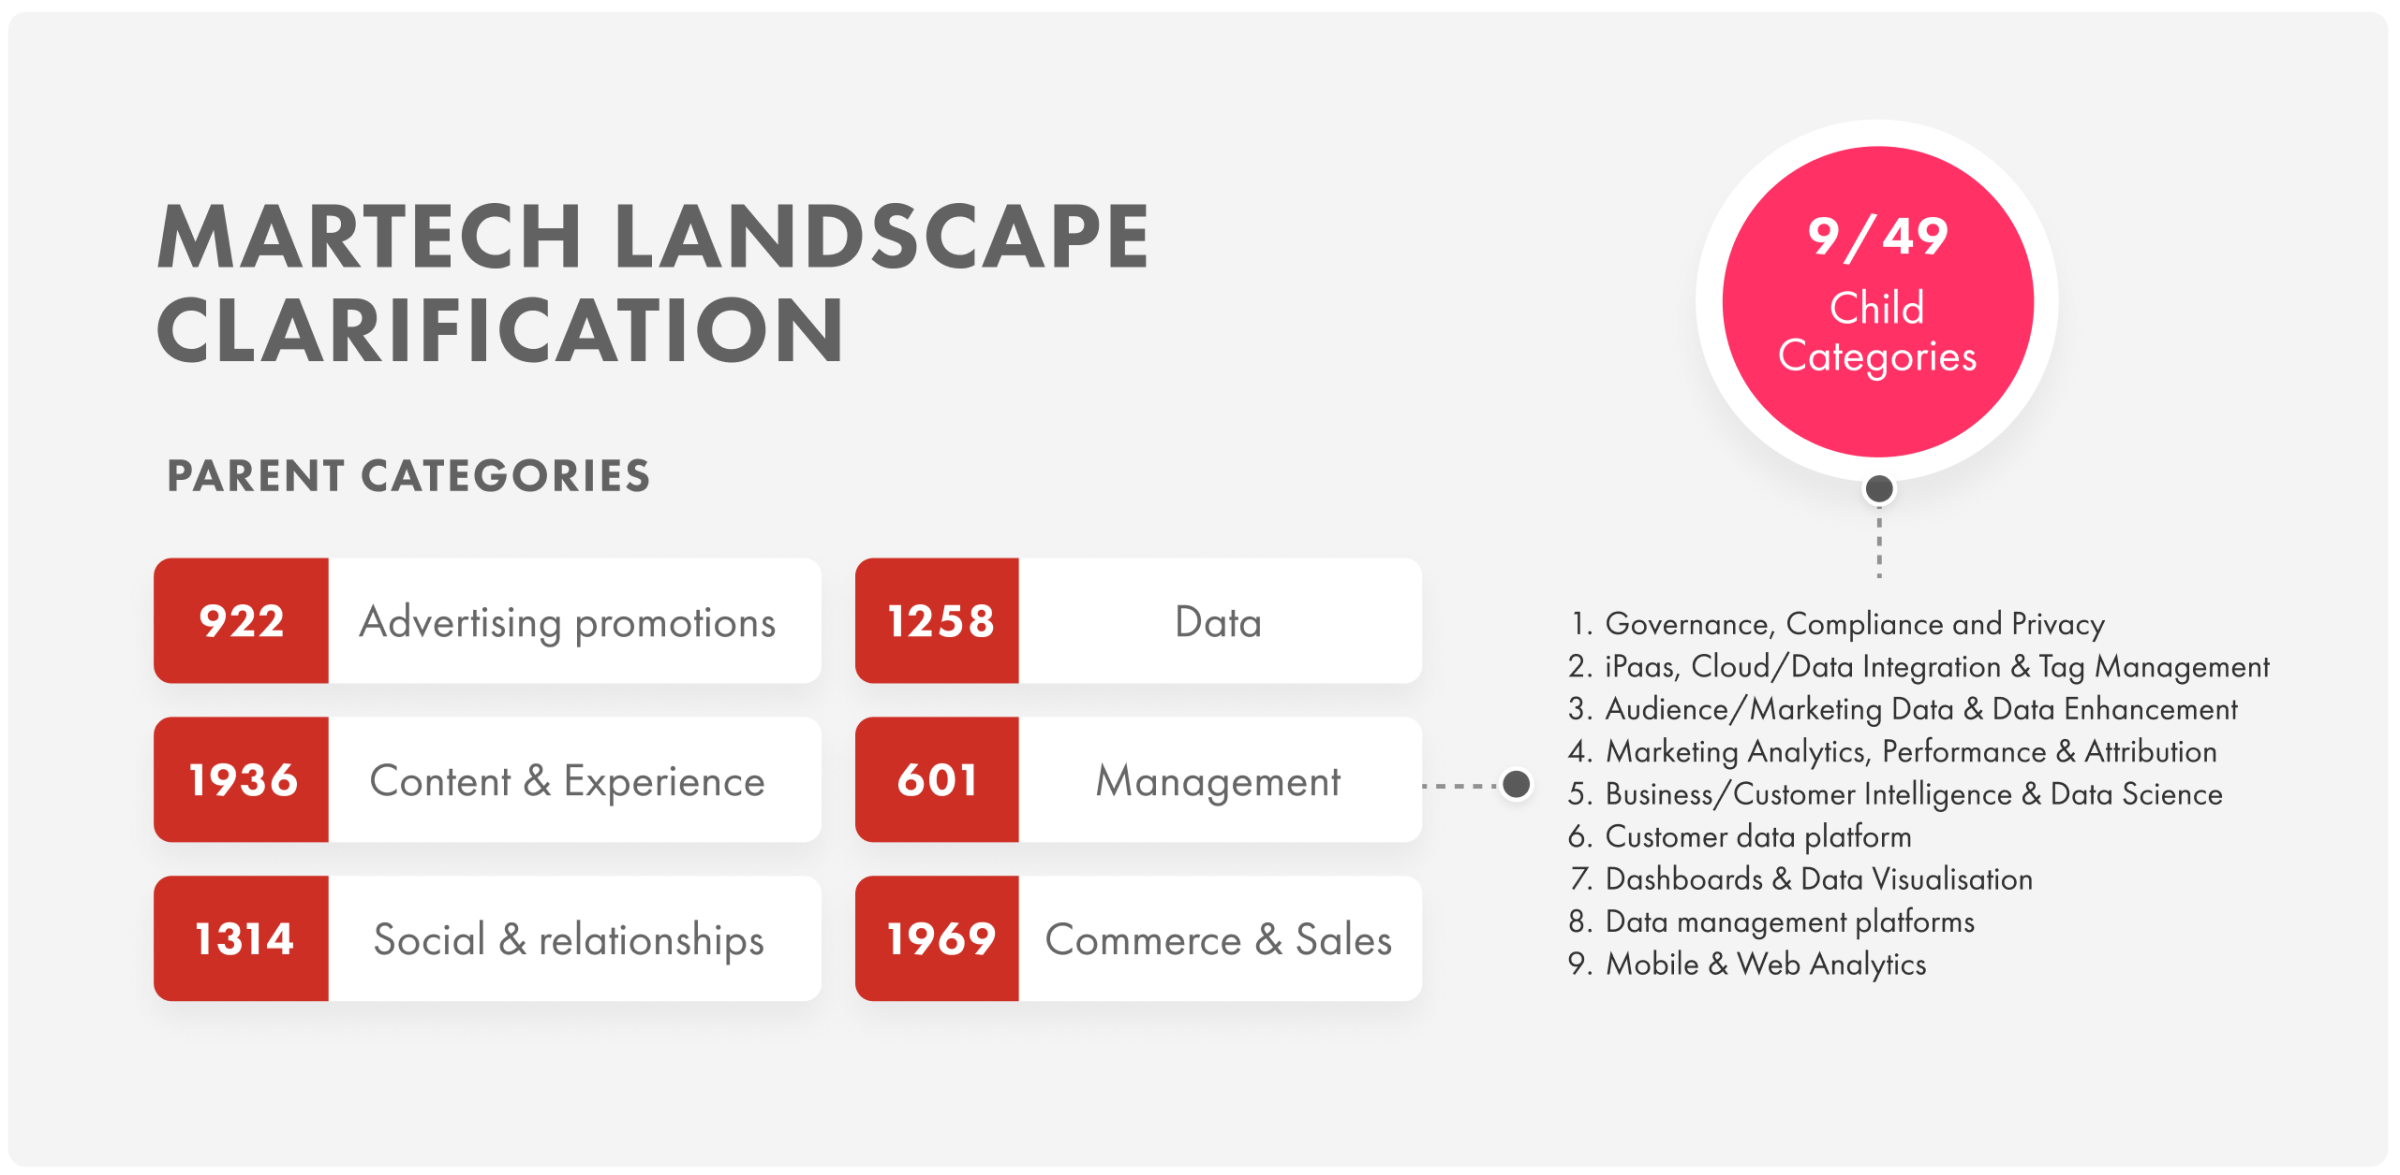
Much of our research focused on the changes within the categories that make up the MarTech landscape. There were a total of 6 parent categories, covering 49 subcategories. Full details of the categorisation methodology can be found at Scott Brinker’s chiefmartech landscape.
2. Landscape Domination
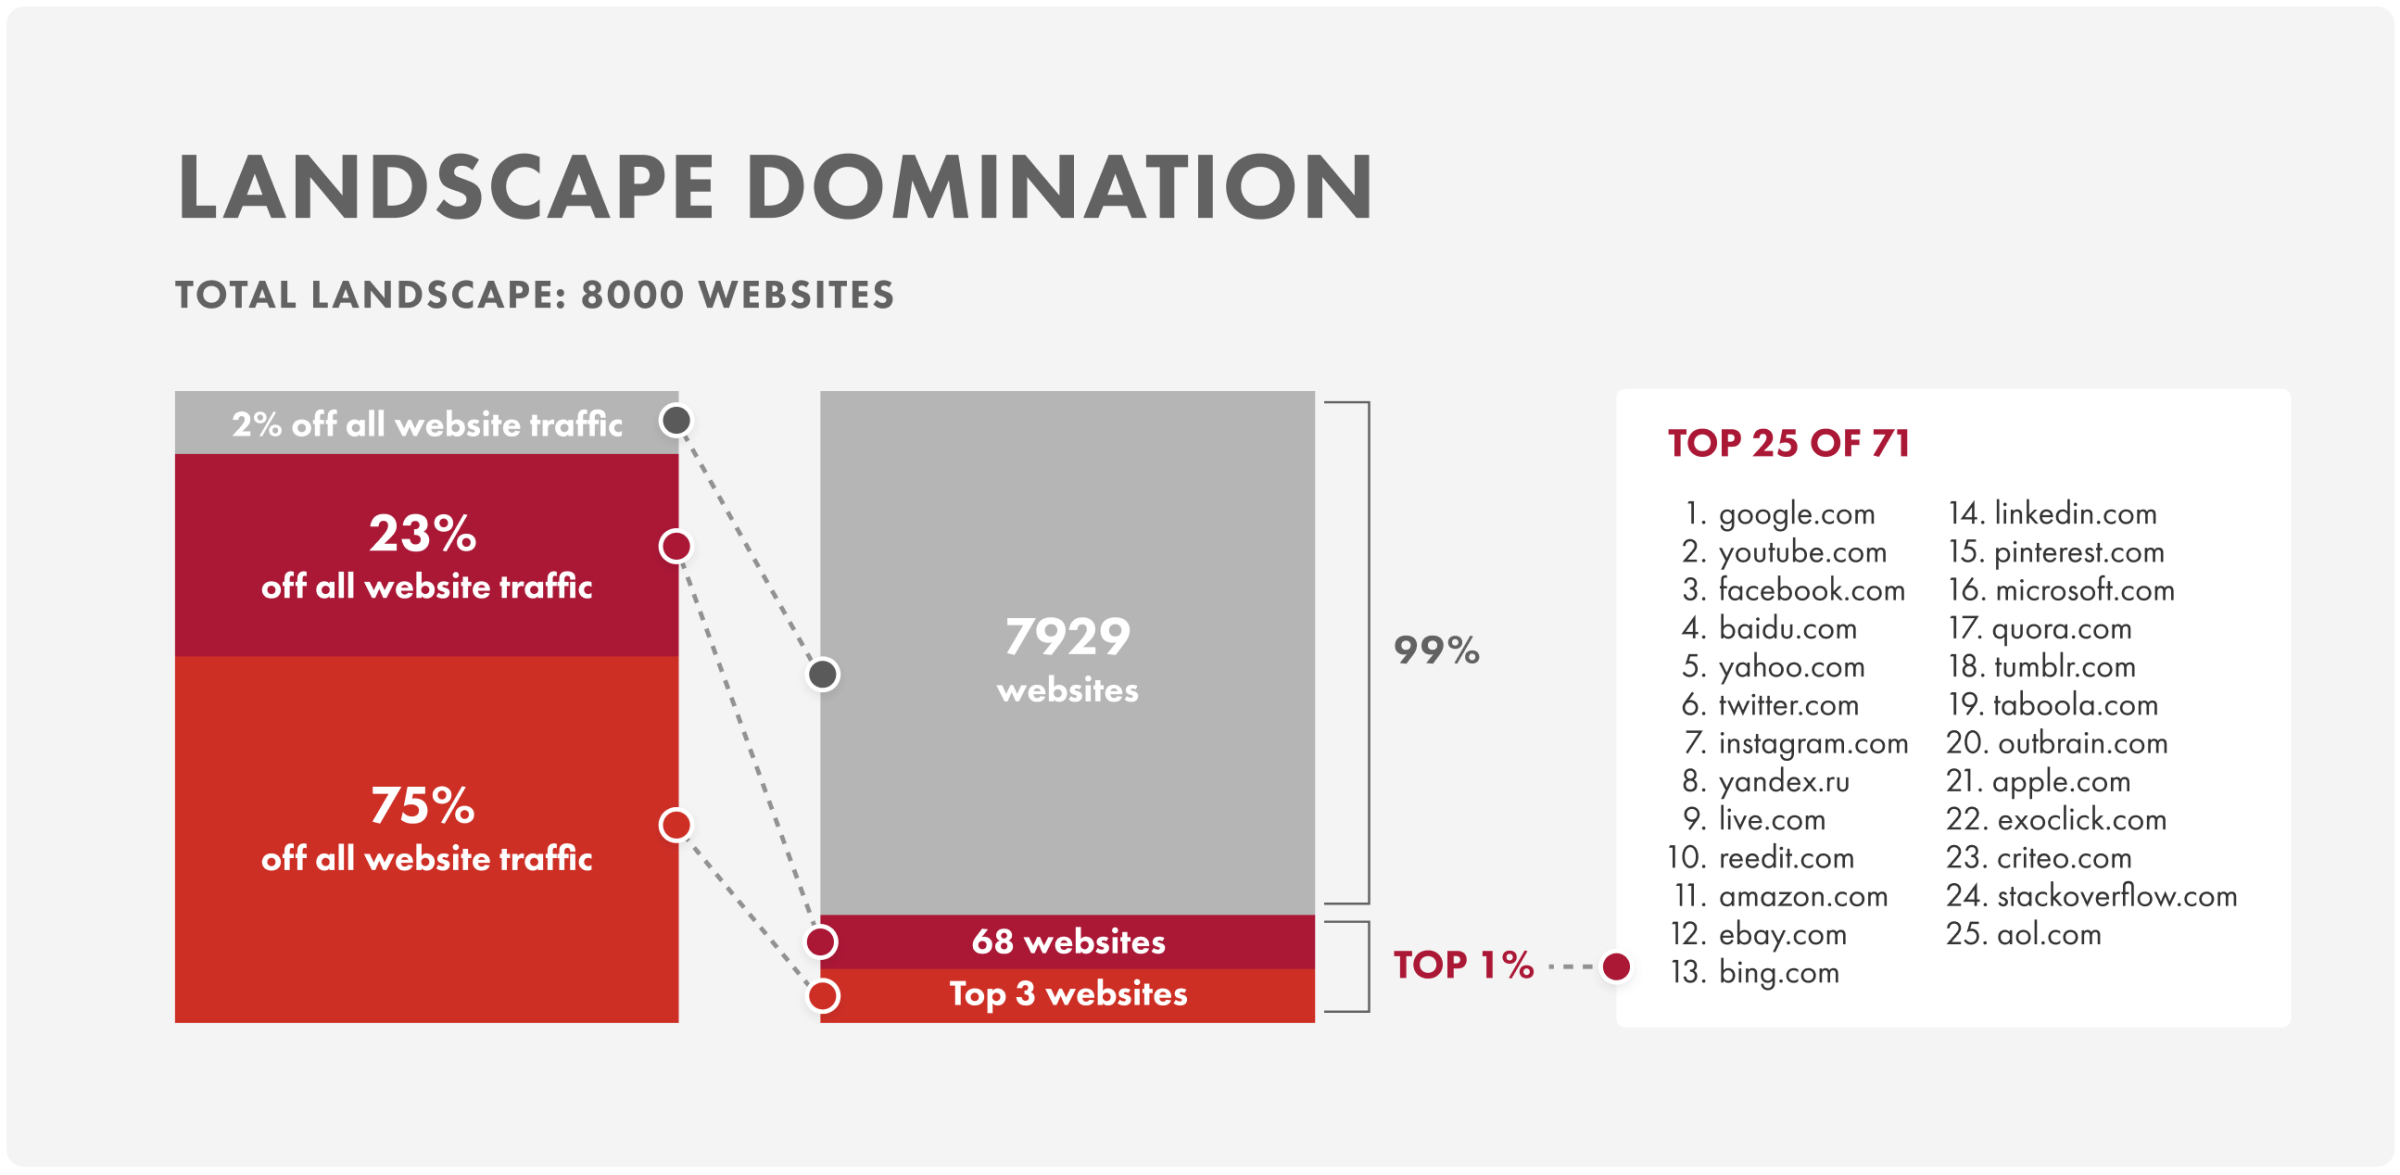
Perhaps the biggest observation from our research was that 75% of total traffic went to just 3 websites out of the 8000. The next 68 websites, another relatively small number, drove a further substantial chunk. When combined with the Big 3, this suggests that just 1% of the websites drove a staggering 98% of the total traffic.
While many of the websites dominating this landscape aren’t surprising (e.g. YouTube, Twitter, etc.), we found it interesting that amongst them were Criteo, Outbrain & Taboola, as these are not destinations per se but rather intermediaries.
3. Total Growth
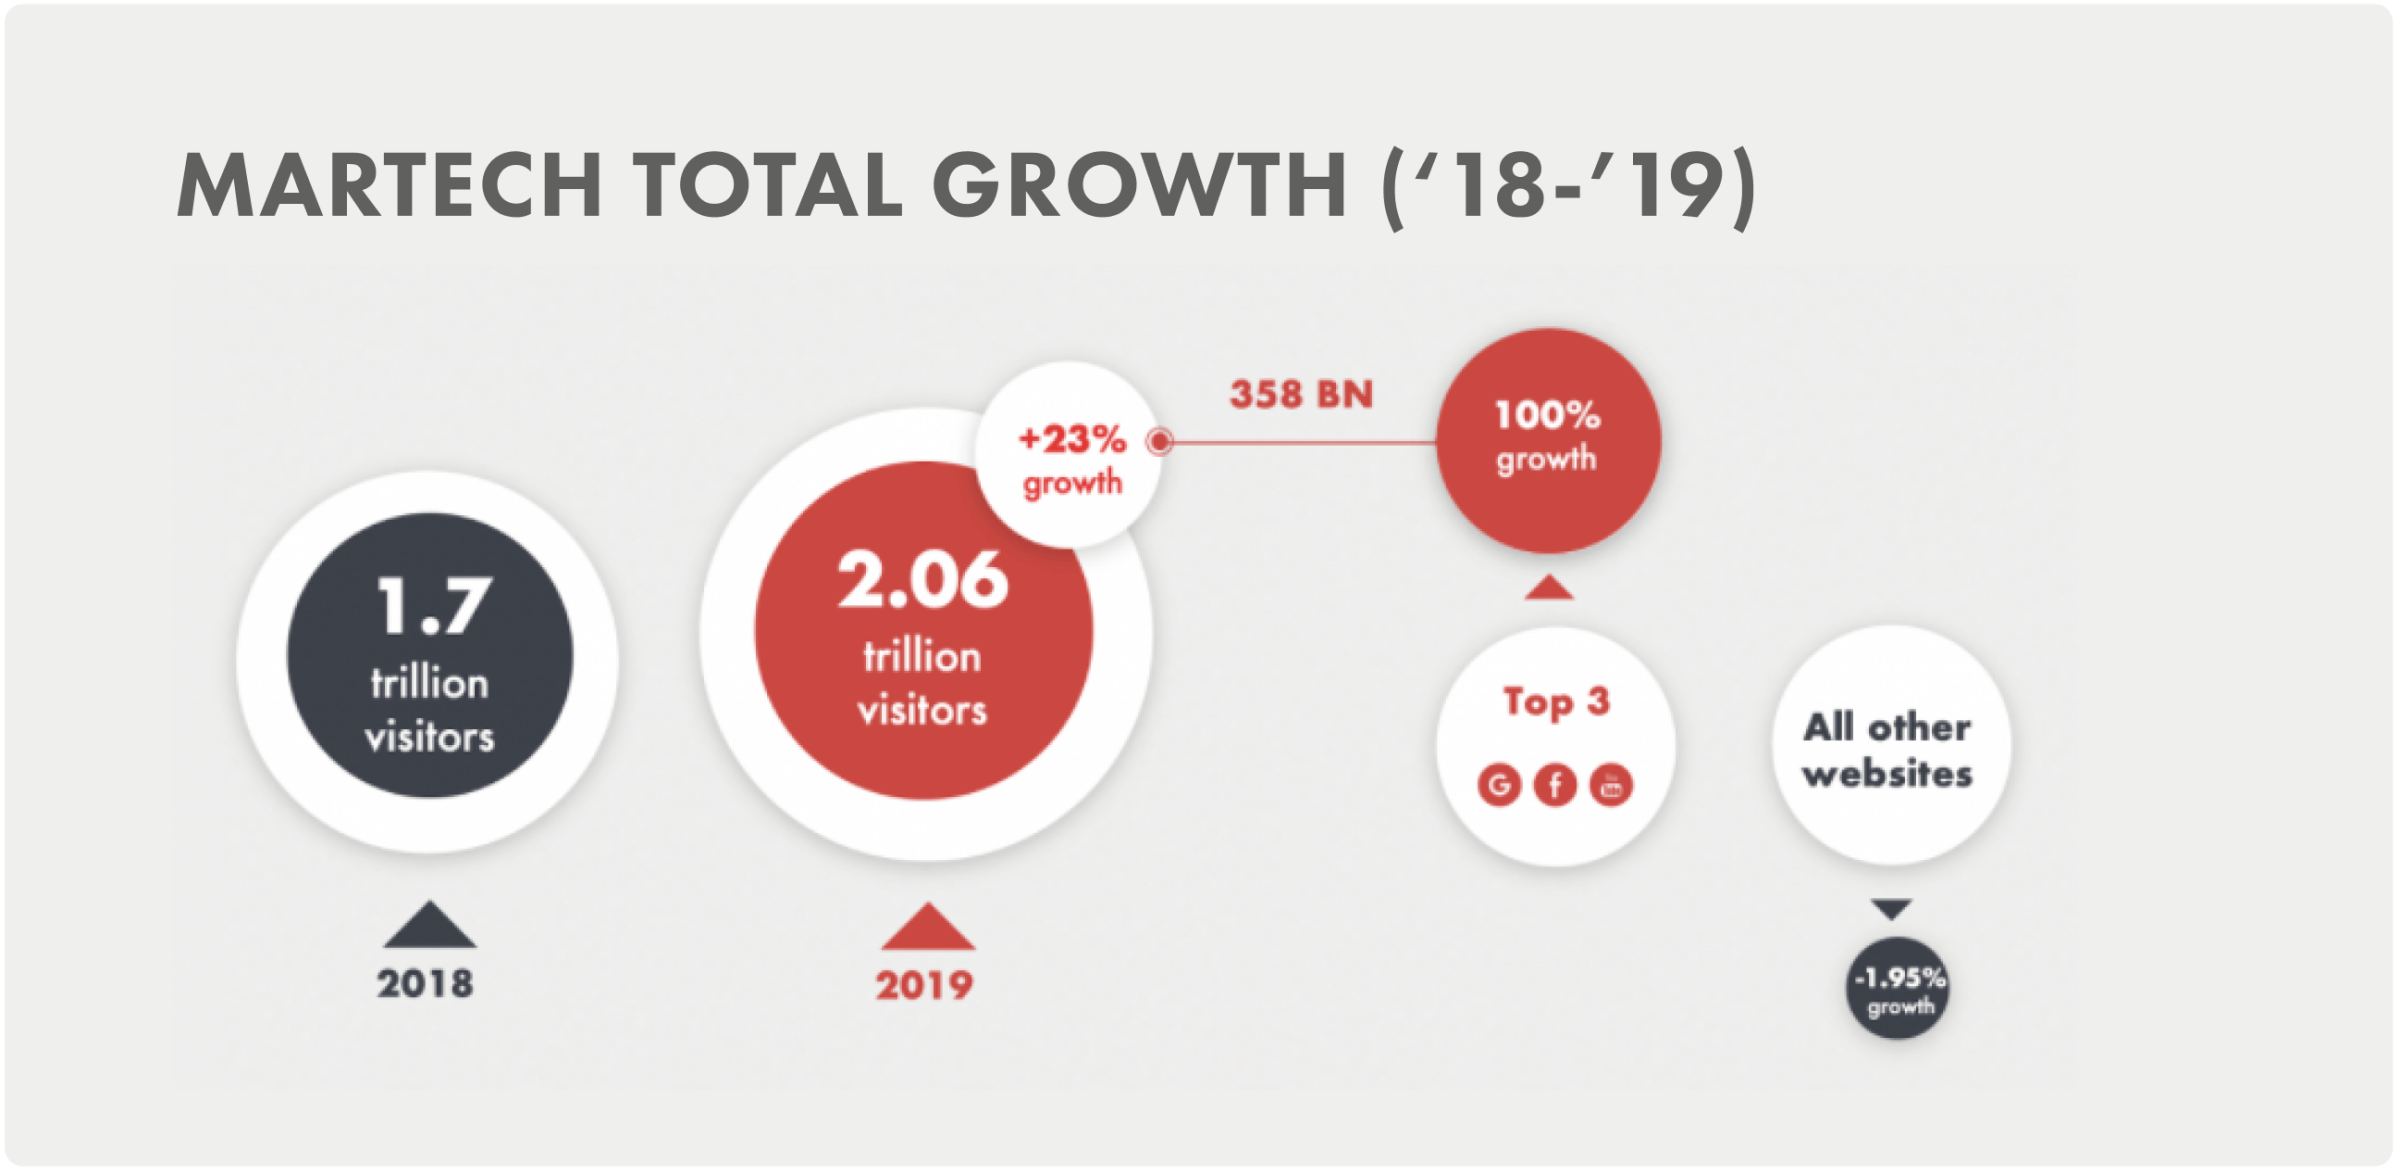
There was a big jump in MarTech visitor numbers from 2018-2019 – figures show a 23% overall growth. Interestingly, the top 3 websites grew 100% while the remaining websites from the 8,000 shrank 1.95%. Considering the sheer volume of websites in existence, and the tiny fraction of them that actually drives the largest portion of traffic, this all shows how fiercely competitive the landscape is.
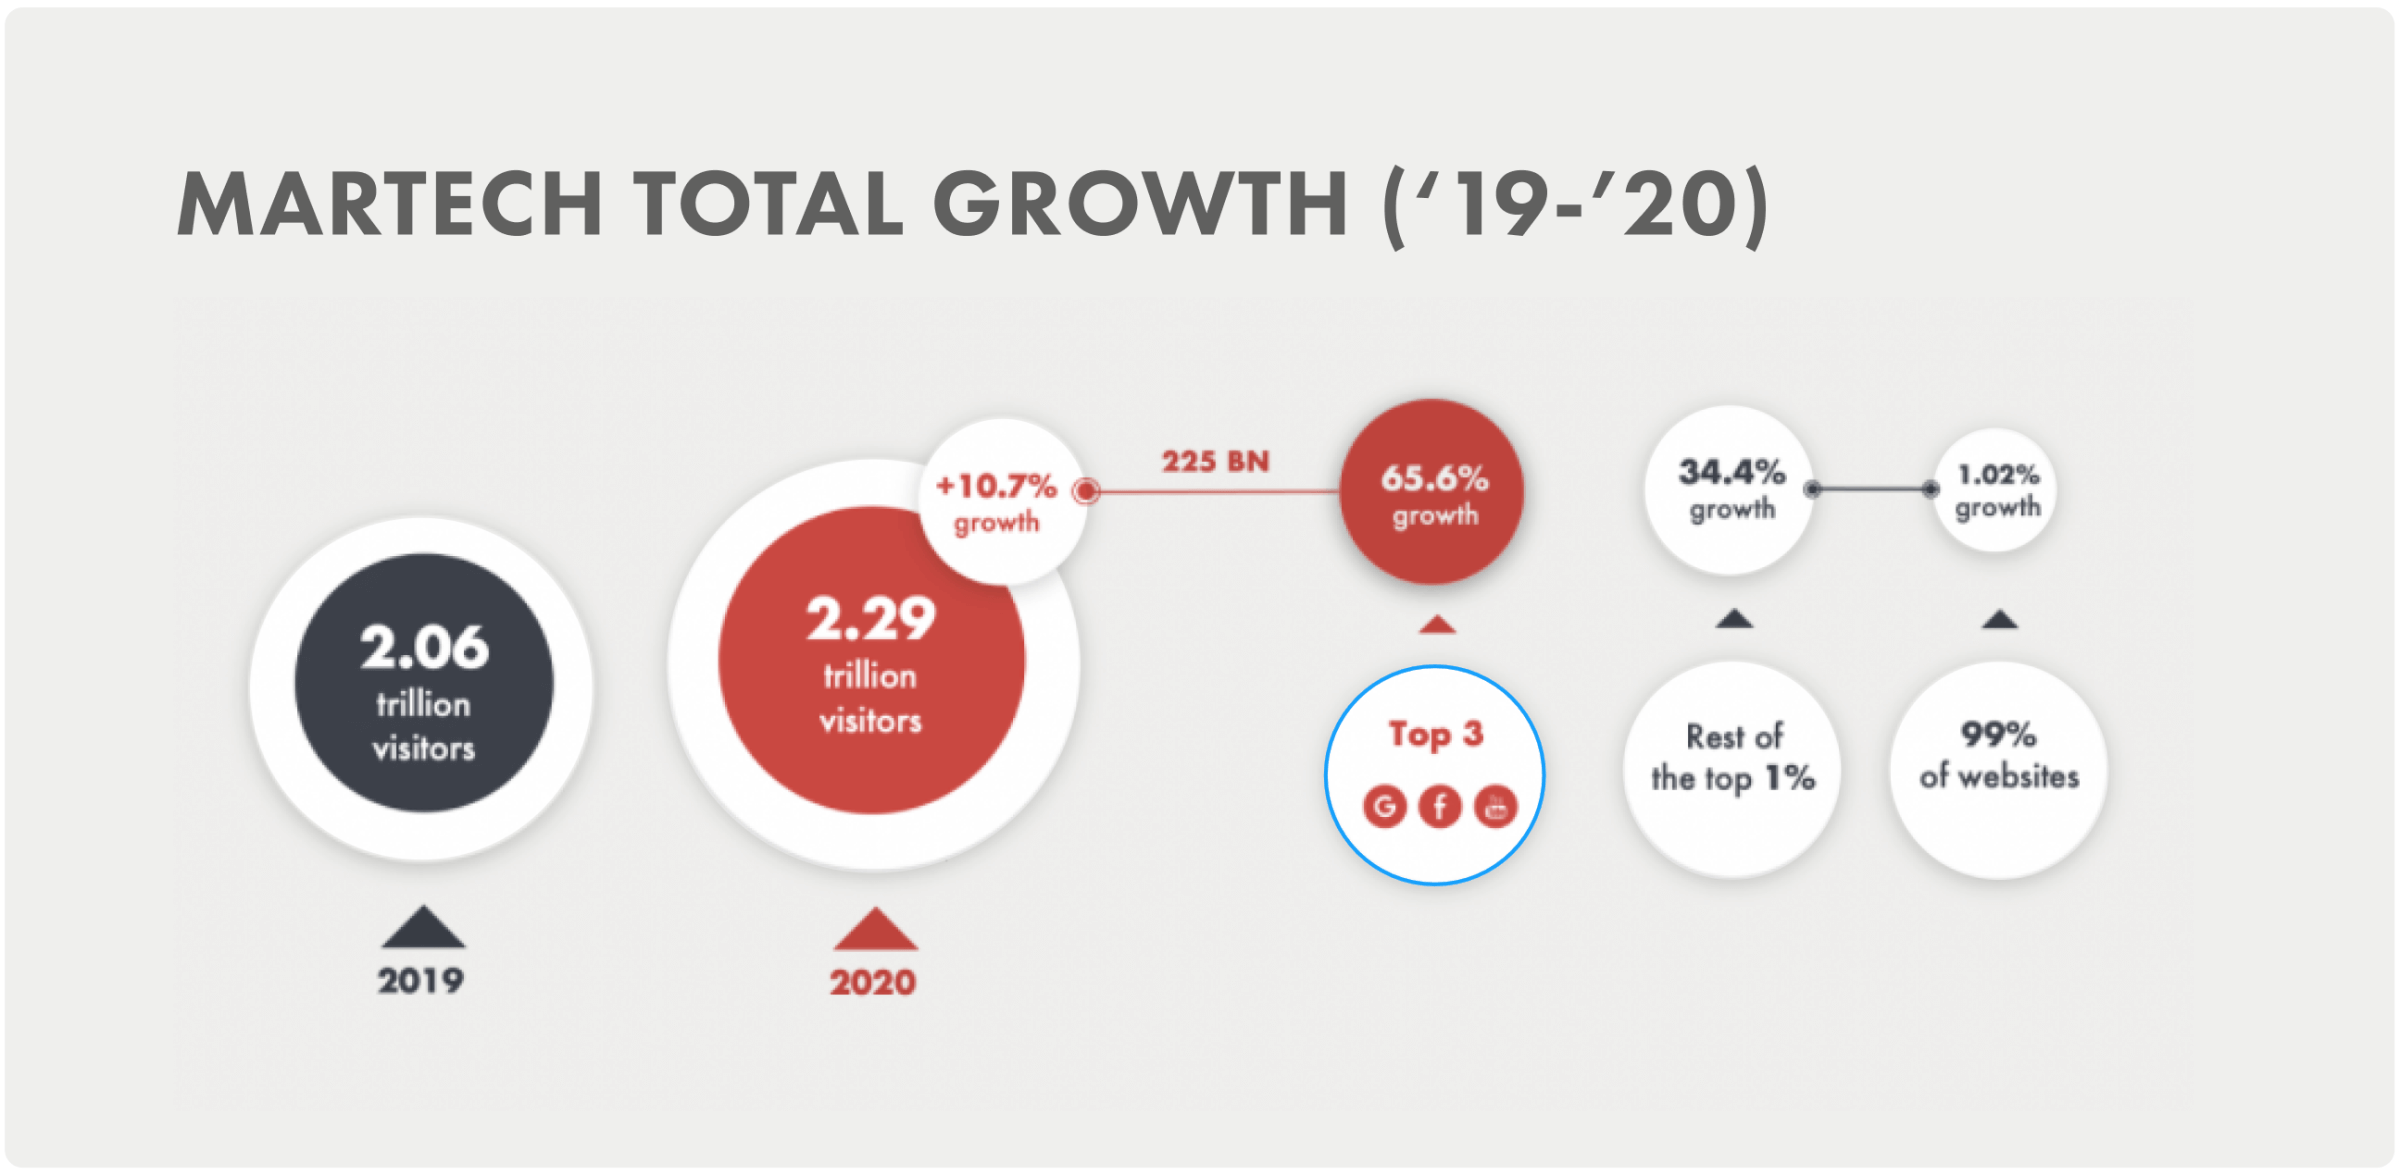
Numbers confirm further growth in visitors to MarTech sites from 2019-2020, which shows great opportunities for revenue generation. However, this top 1% still dominates by far, with the remaining 99% only growing by around 1%. It is interesting to note that businesses don’t benefit solely from traffic to their websites. In fact, they can also build their own authority and get traffic on other platforms that host content (e.g. Medium).
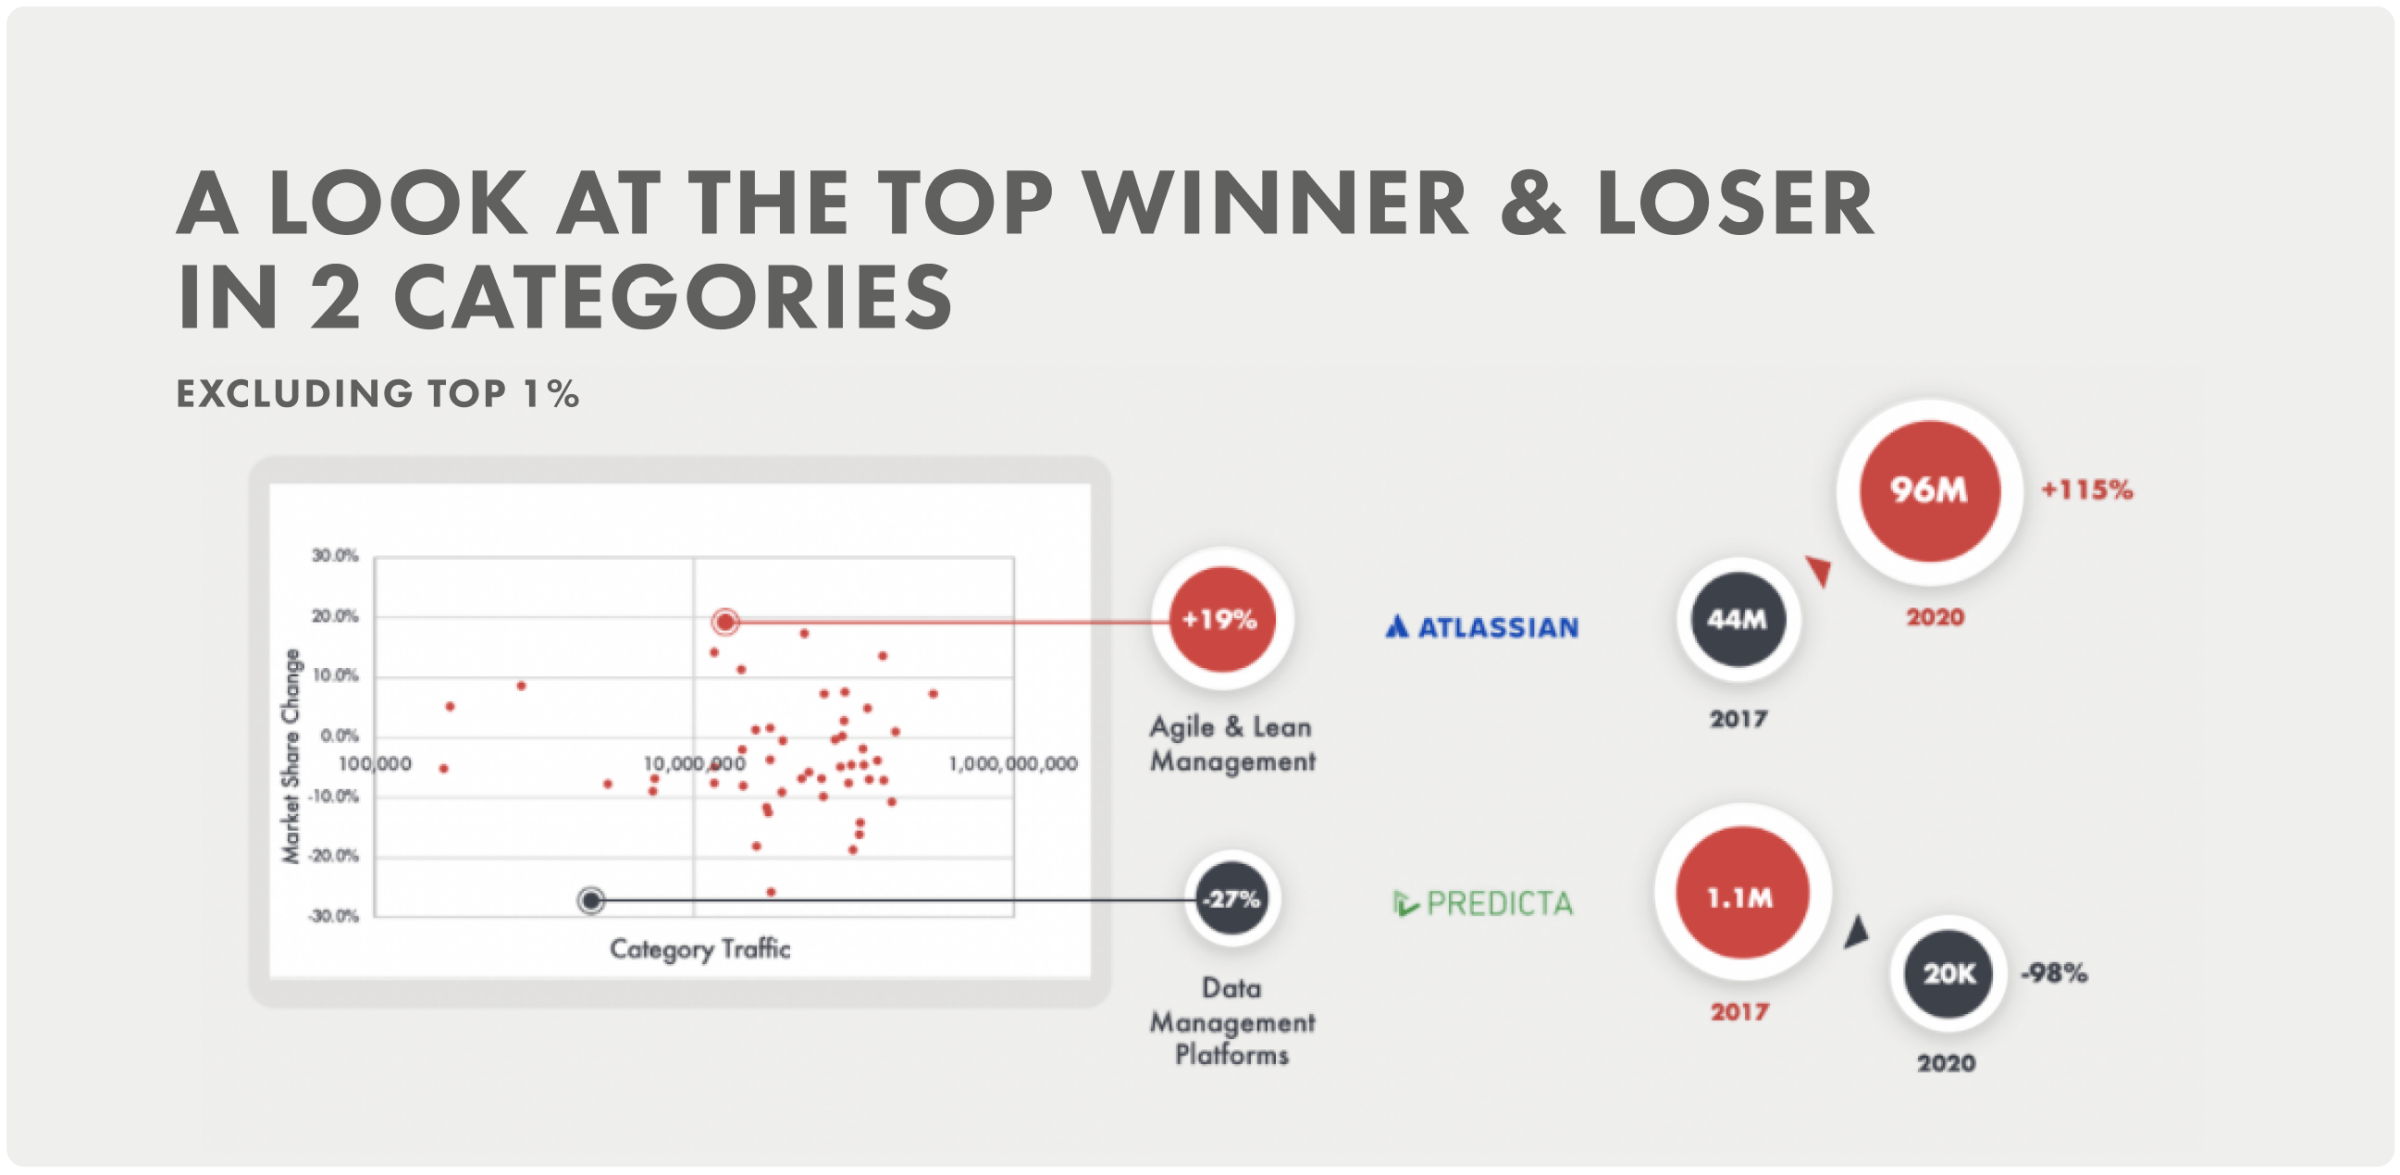
To look deeper into the landscape, we looked beyond the 1% to assess market share performance in the period between 2017 and 2020. We identified that Atlassian was the biggest winner with 115%, and Predicta suffered the worst, falling by 98%.
4. Top Categories
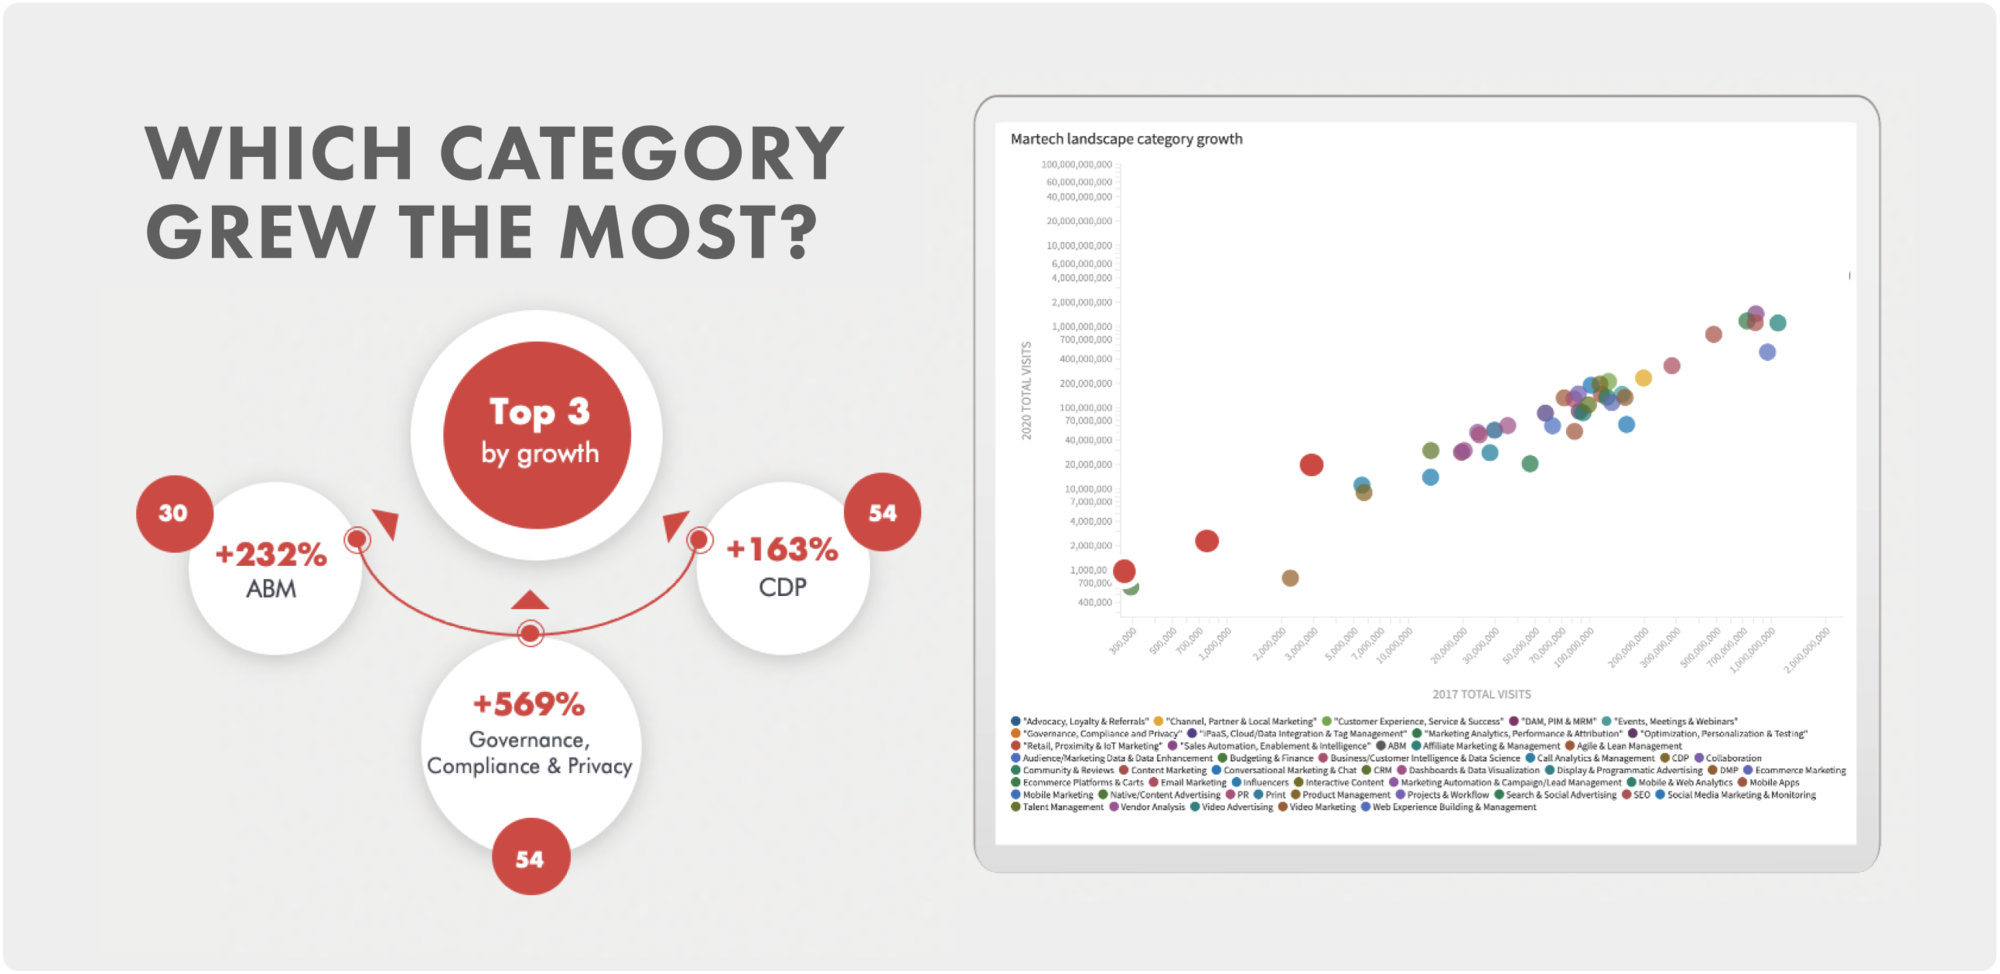
We then wanted to see which were the fastest growing categories. Unsurprisingly, given GDPR and changing privacy laws, we found that GCP was by far the biggest grower. The next was ABM, a small category with only 30 players. This growth may imply that sales and marketing will increasingly start closely together and that the value of ABM is becoming more apparent.
The next biggest grower was CDP (Twilio buying Segment for $3.4B is a good example of this). It is interesting to note that these categories are in their early days and will eventually, like CRM, mature and grow at a more controlled pace.
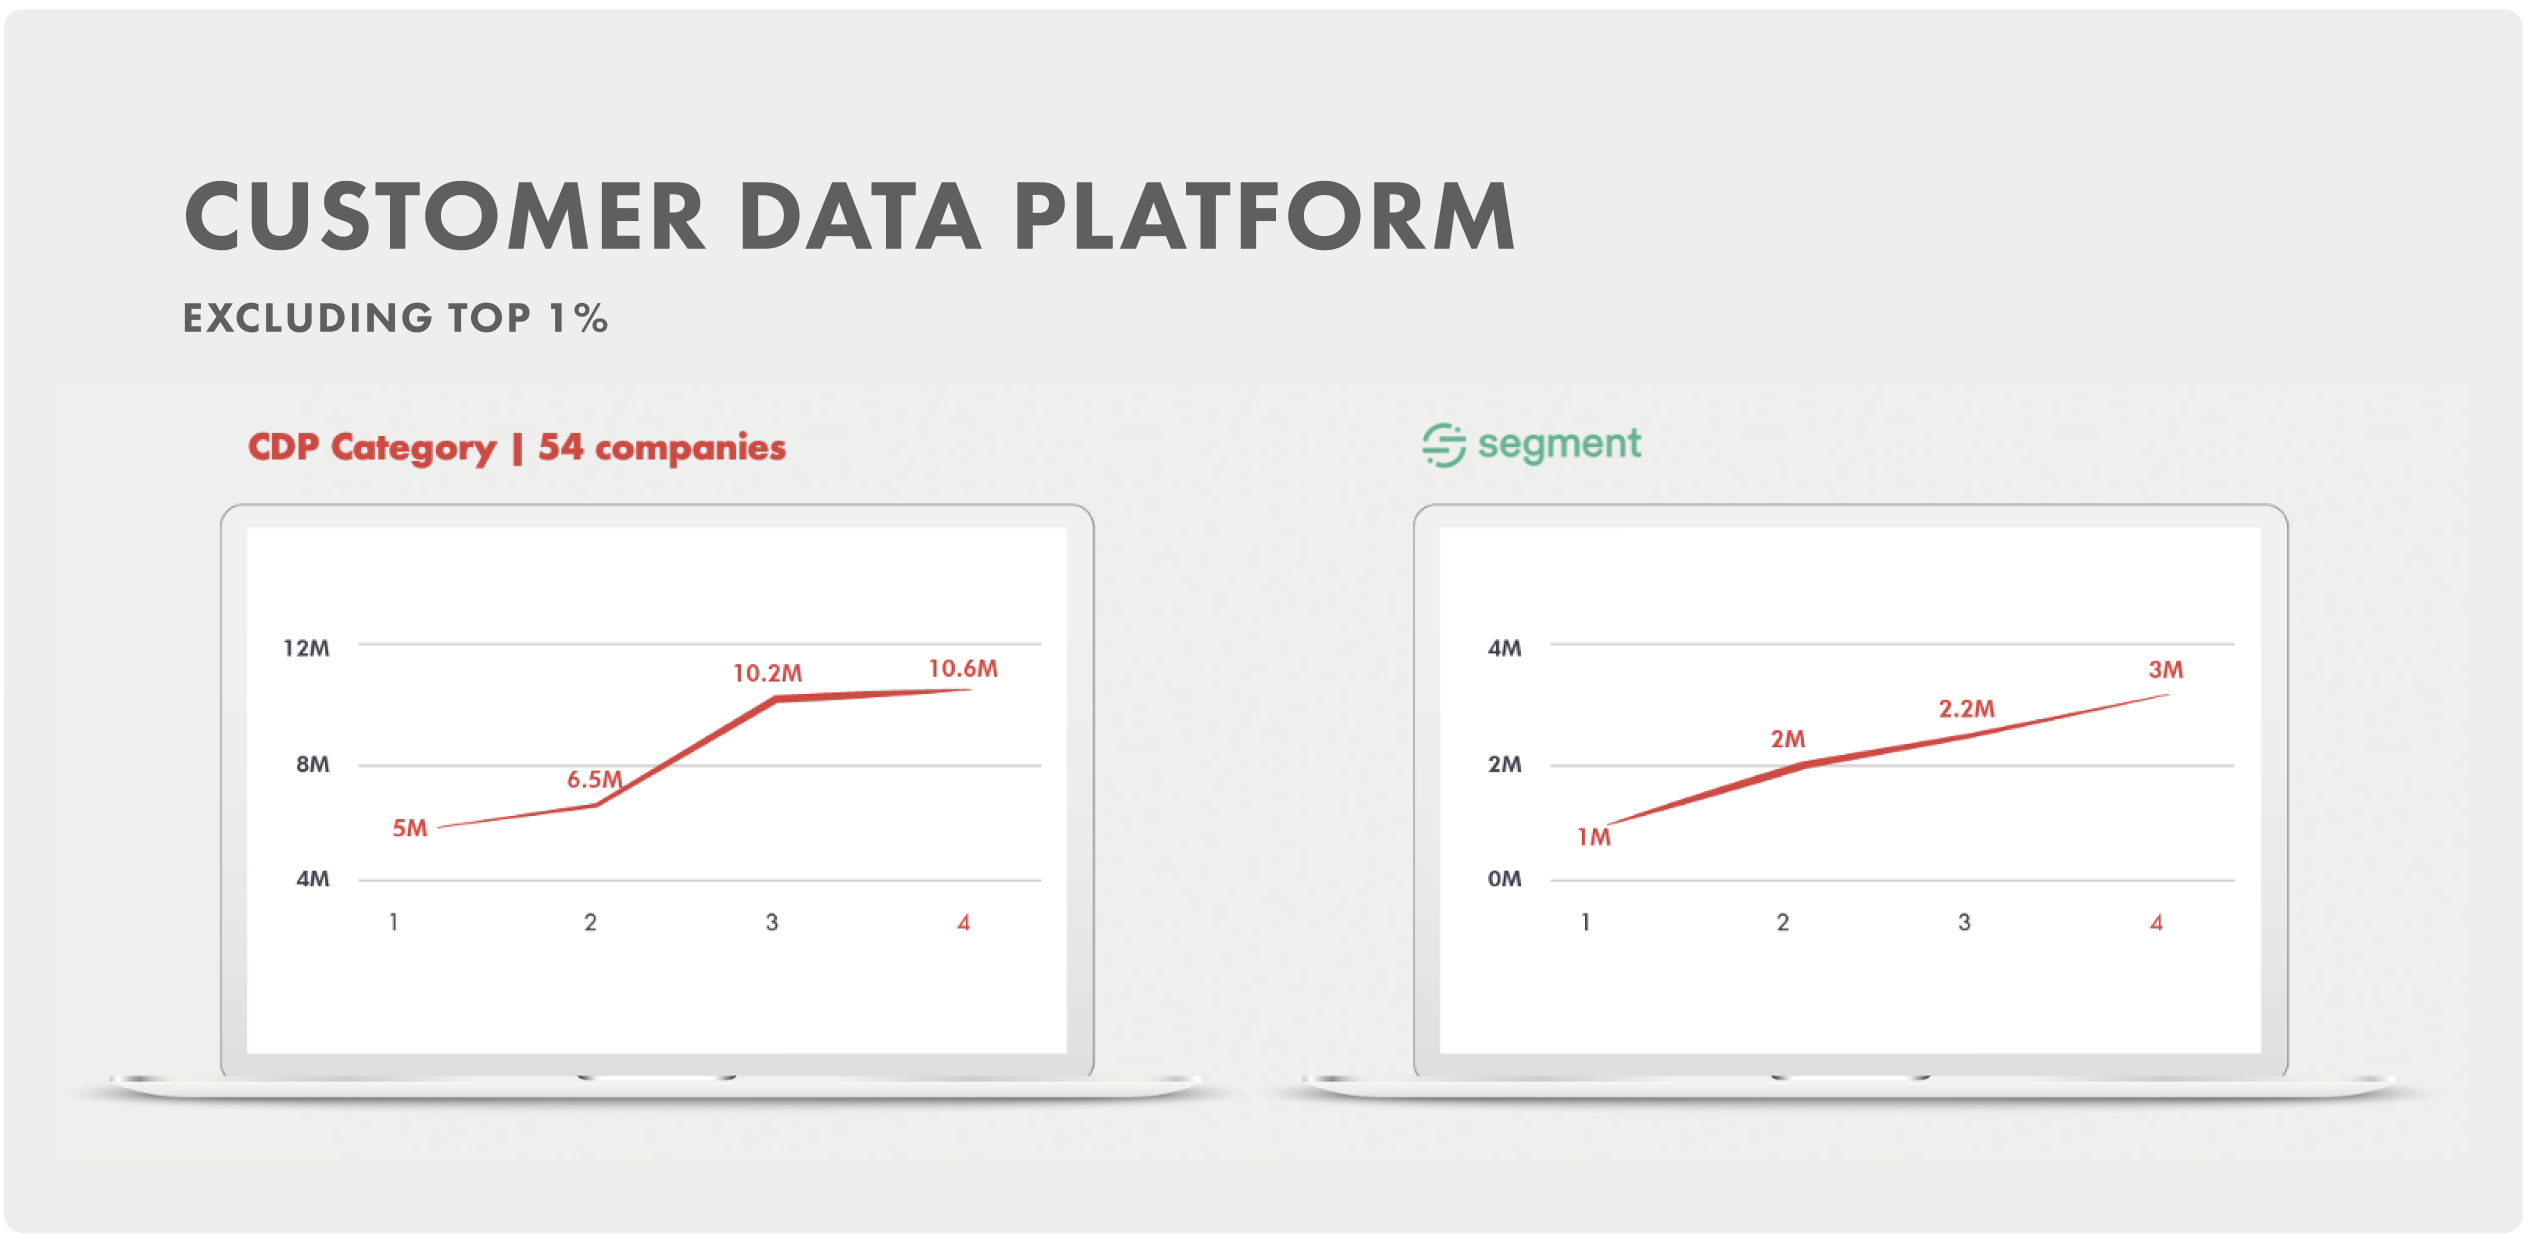
→ CDP
A closer look at CDP shows that the category has grown at a steady pace. The leading player, Segment, appears to have grown at more or less the same rate as its category. It seems as though customer data platforms are replacing the data management platforms, which have declined rapdily. This may have been caused by the decline of cookies and the shift to search and social.
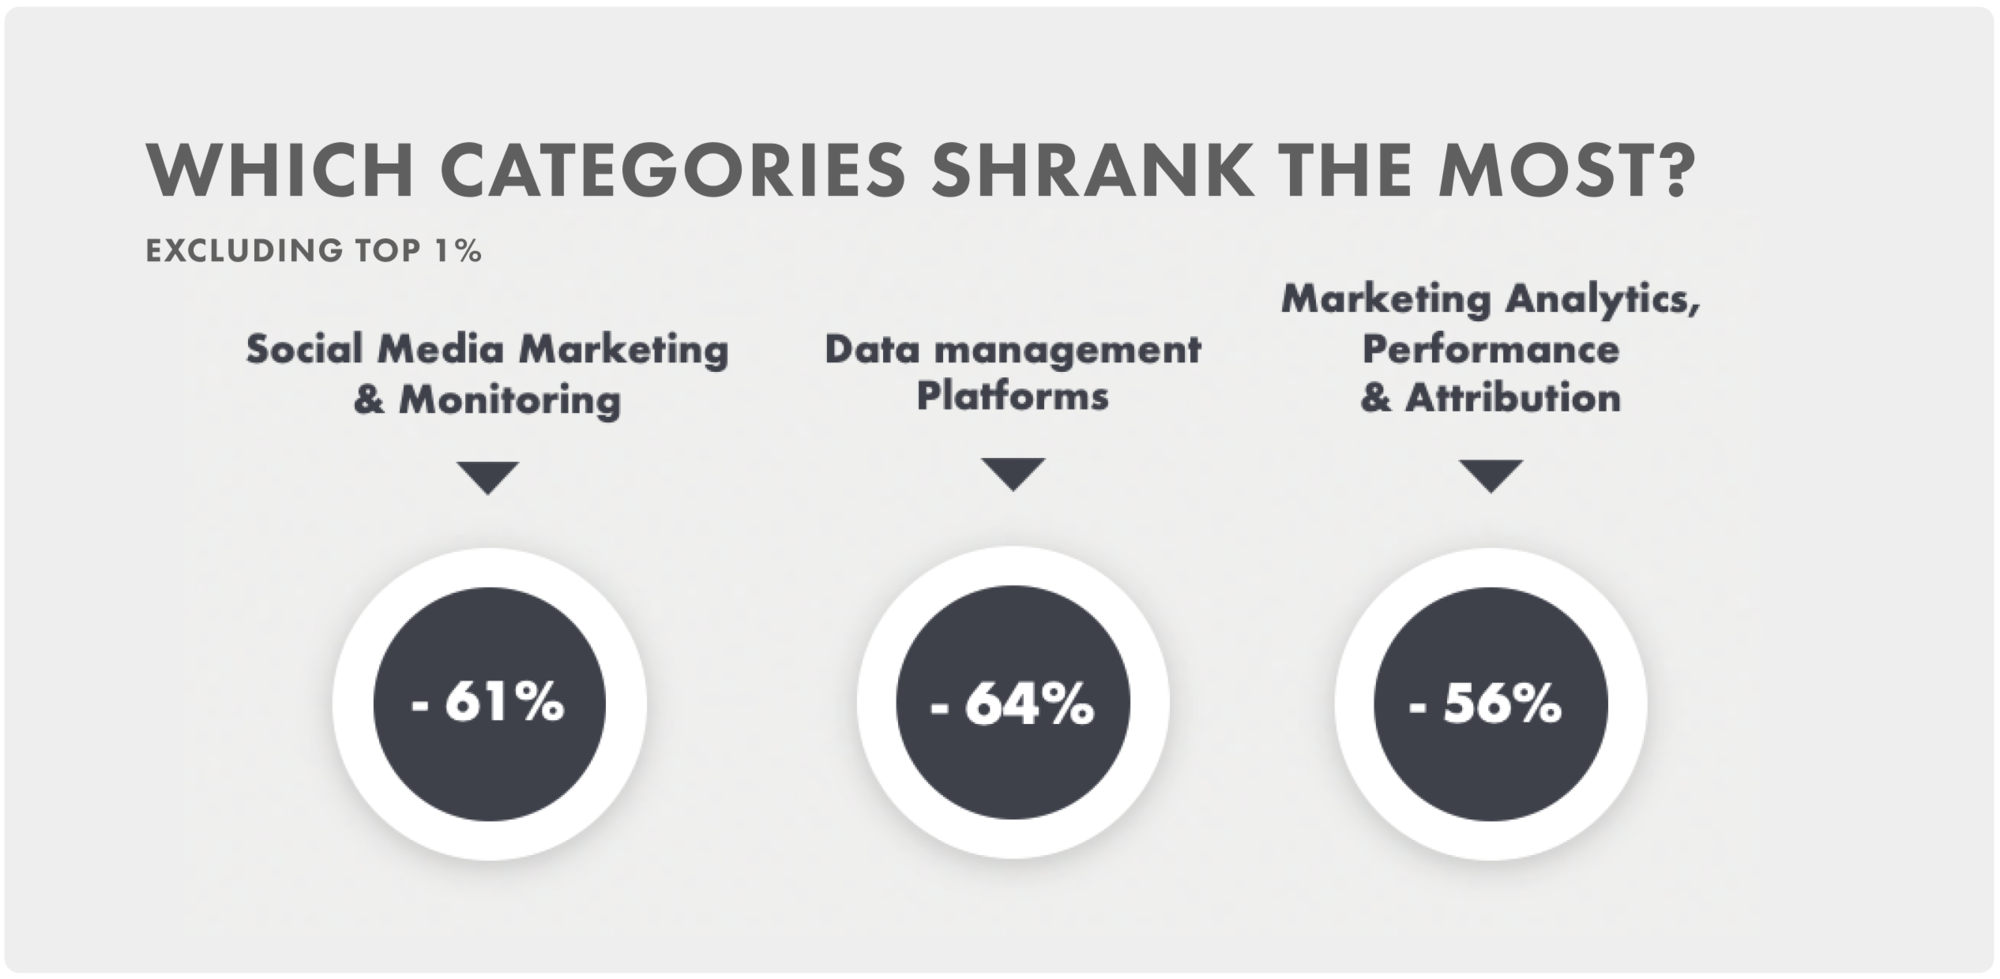
5. Losing Categories
Again, looking beyond the top 1% at categories that shrank the most, we were surprised to see that marketing analytics shrank by a huge 56%. While social media probably isn’t shrinking, rather going through a fragmentation, it’s interesting to see that tools used for it are shrinking.
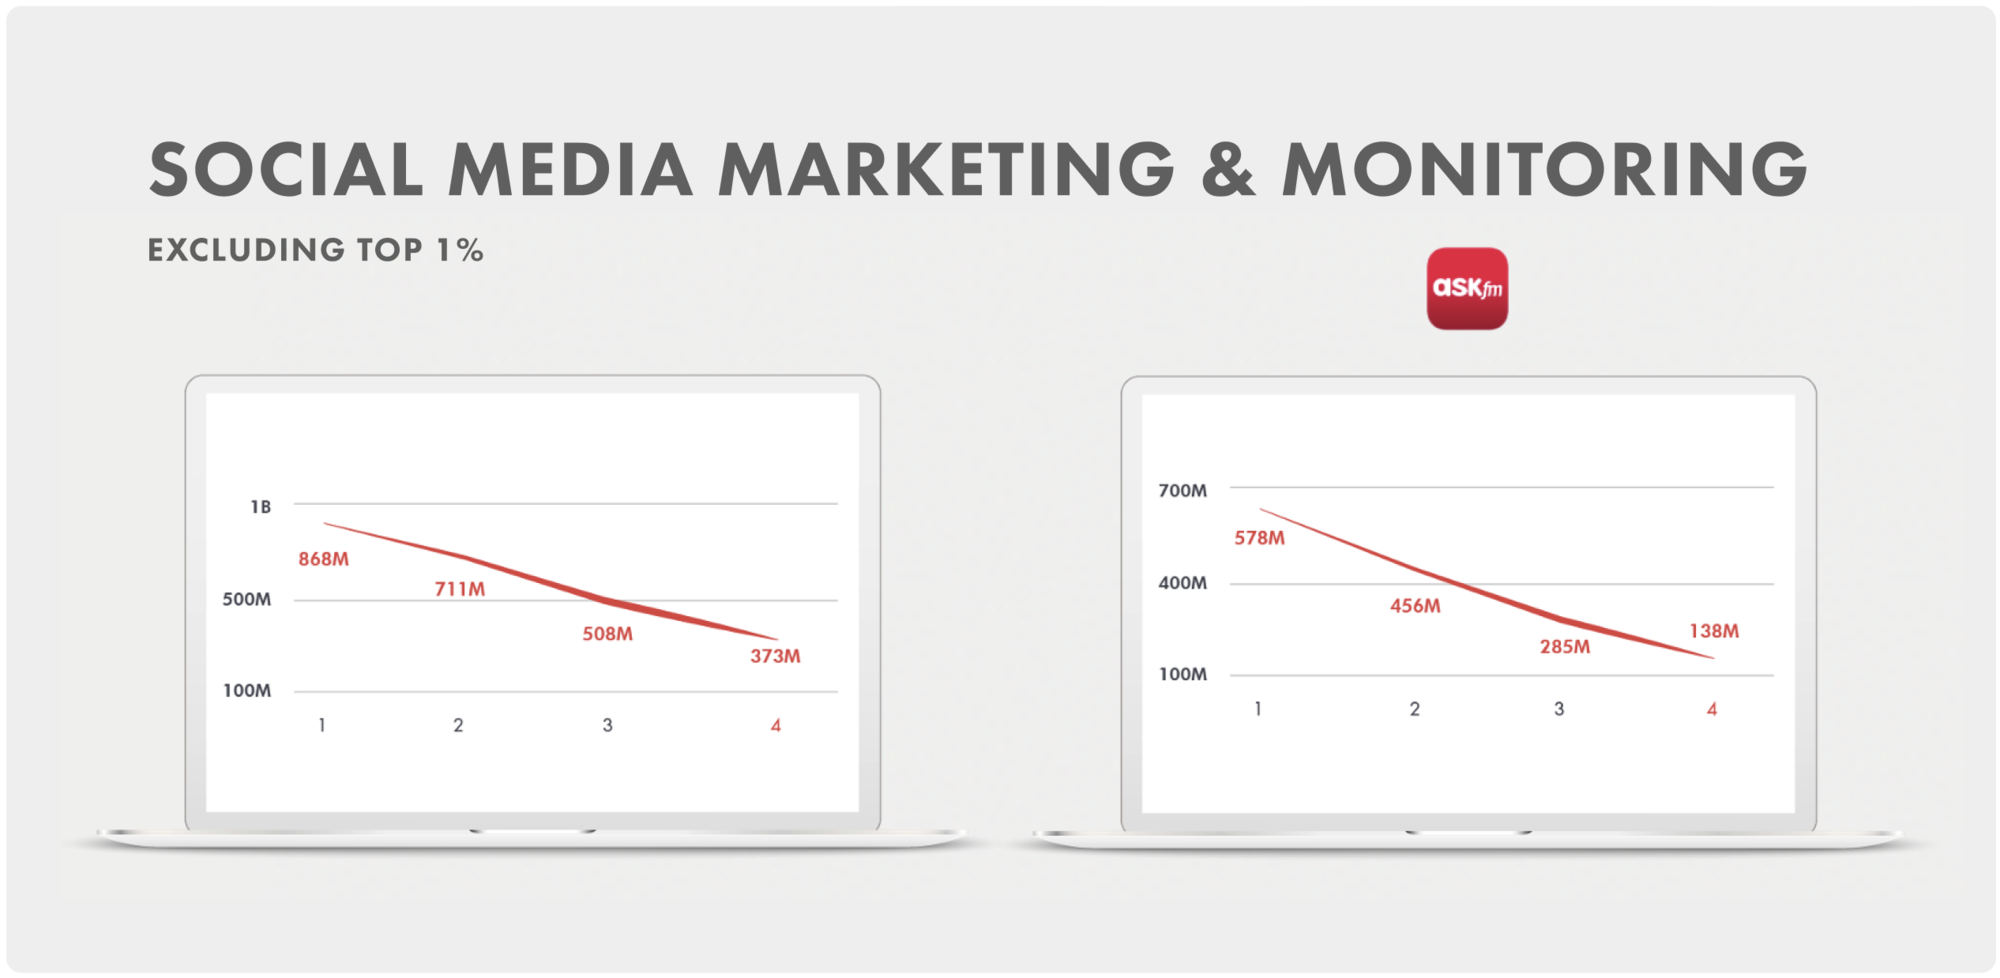
→ Social Media Marketing
What’s most interesting to see is how, as with CDP & Segment, there appears to be a correlation between the leader of a categories’ growth and the overall category.
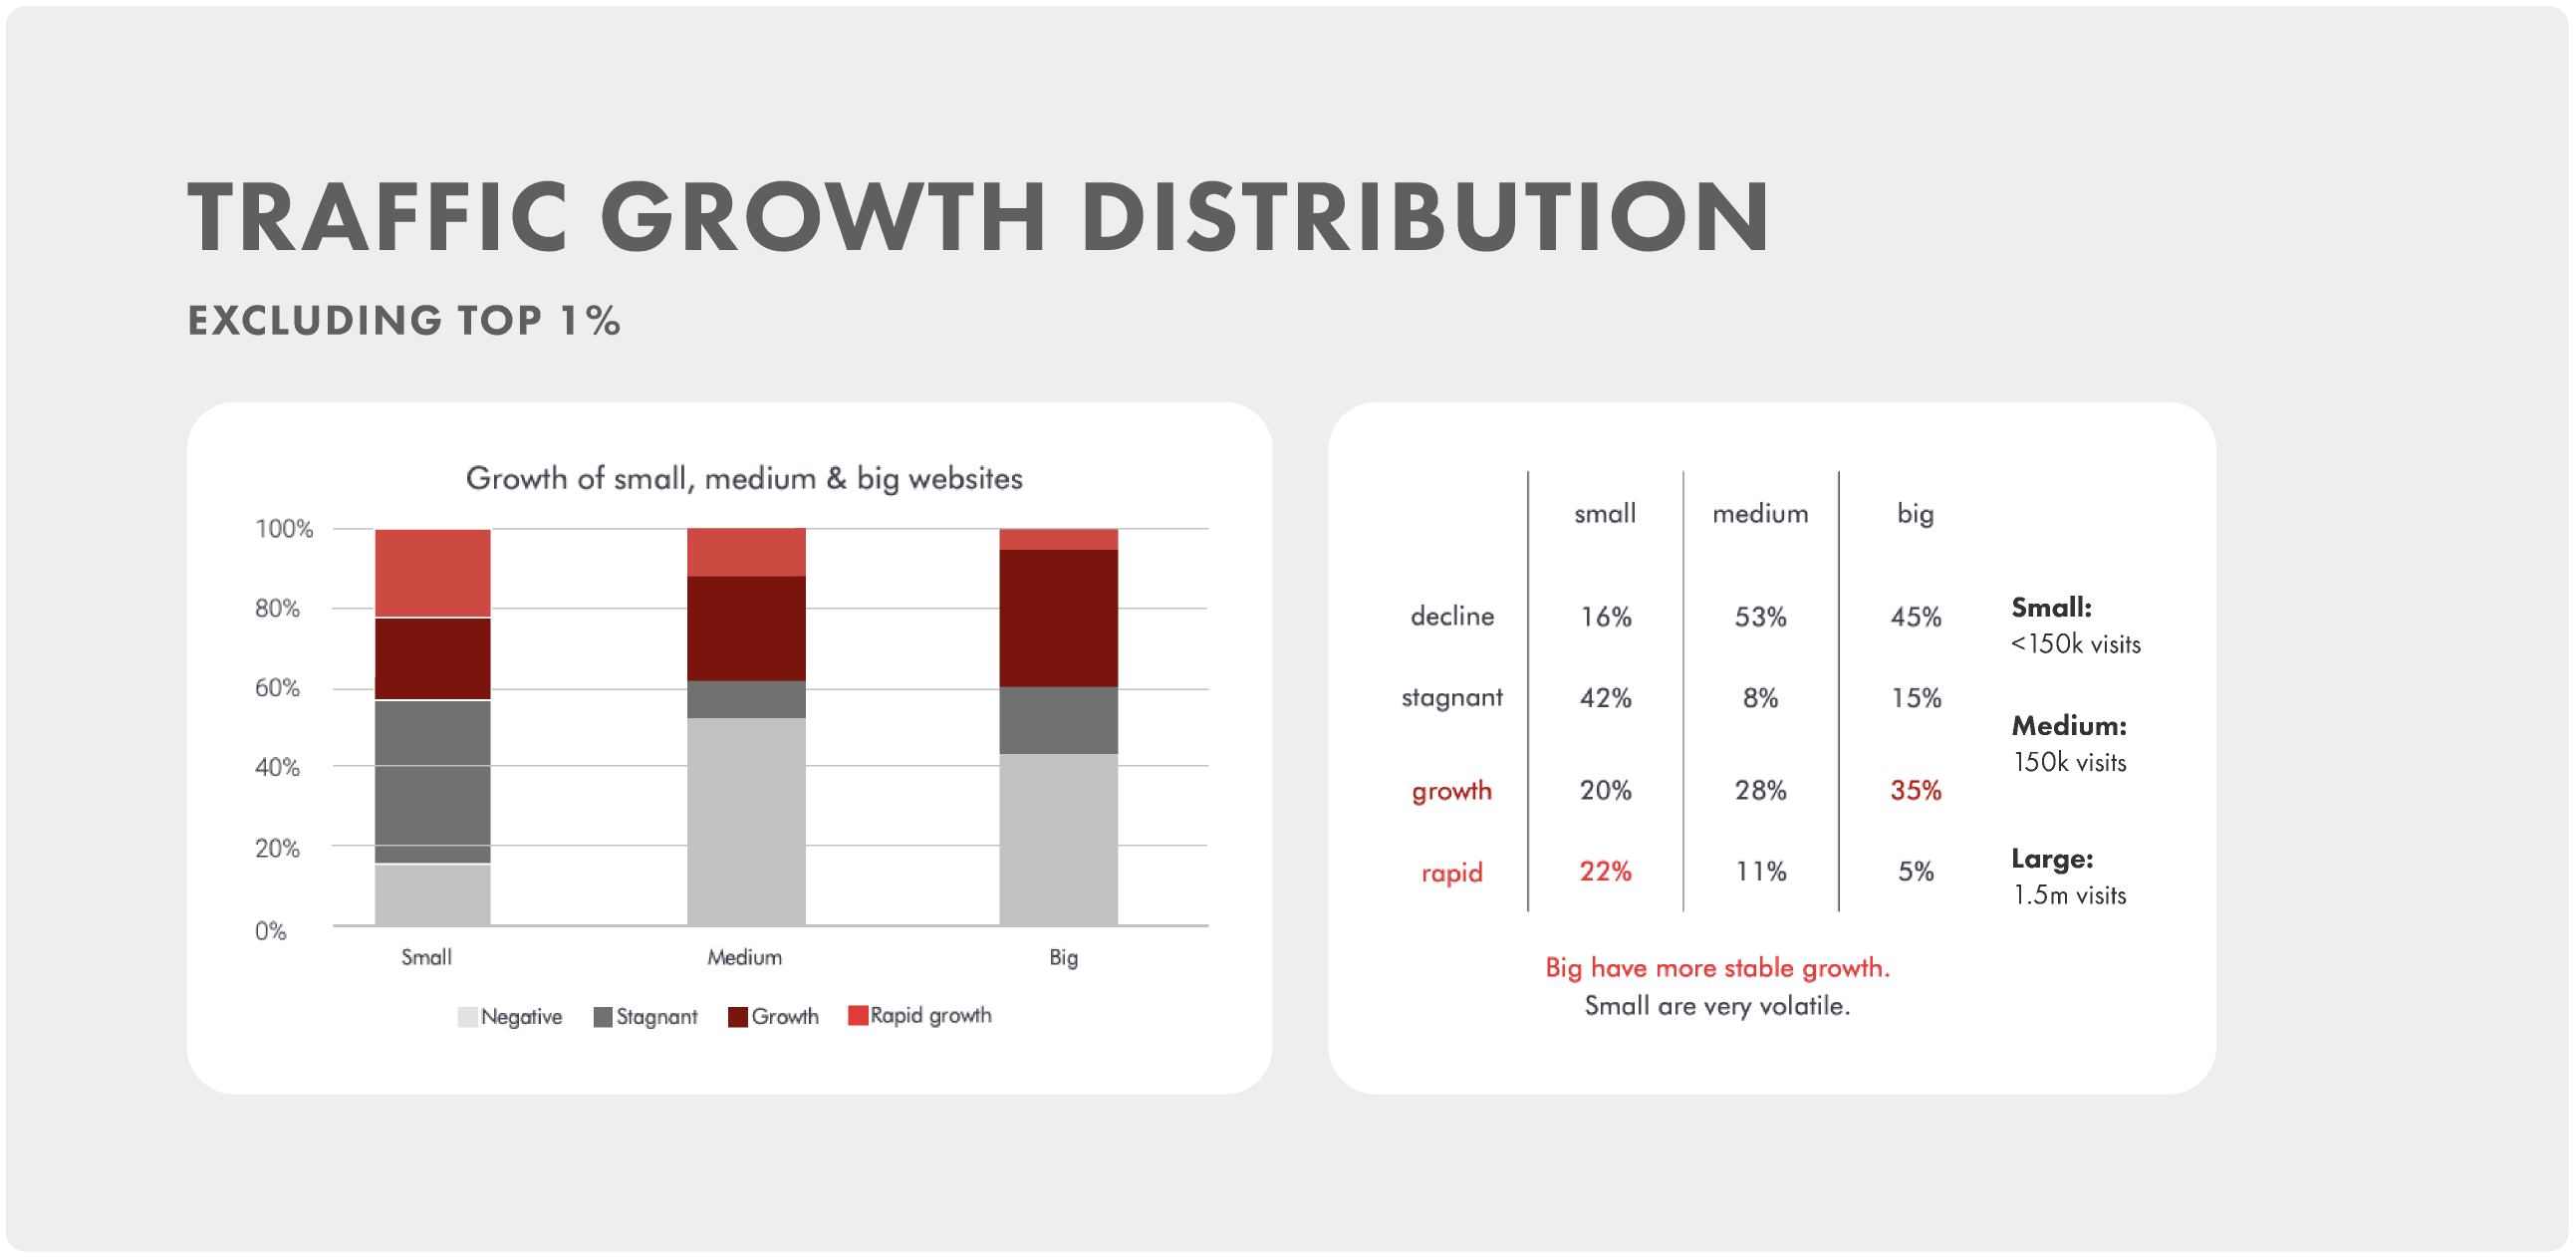
6. Growth Rates
When looking at growth rates beyond the top 1%, we grouped websites into 3 categories by size. The numbers clearly show how difficult it is for small businesses to compete; indeed, they are very much stagnant. However, what we also see is that more small businesses are growing, probably because it’s far easier to grow from 10k to 100k visitors than 10m to 100m visitors.
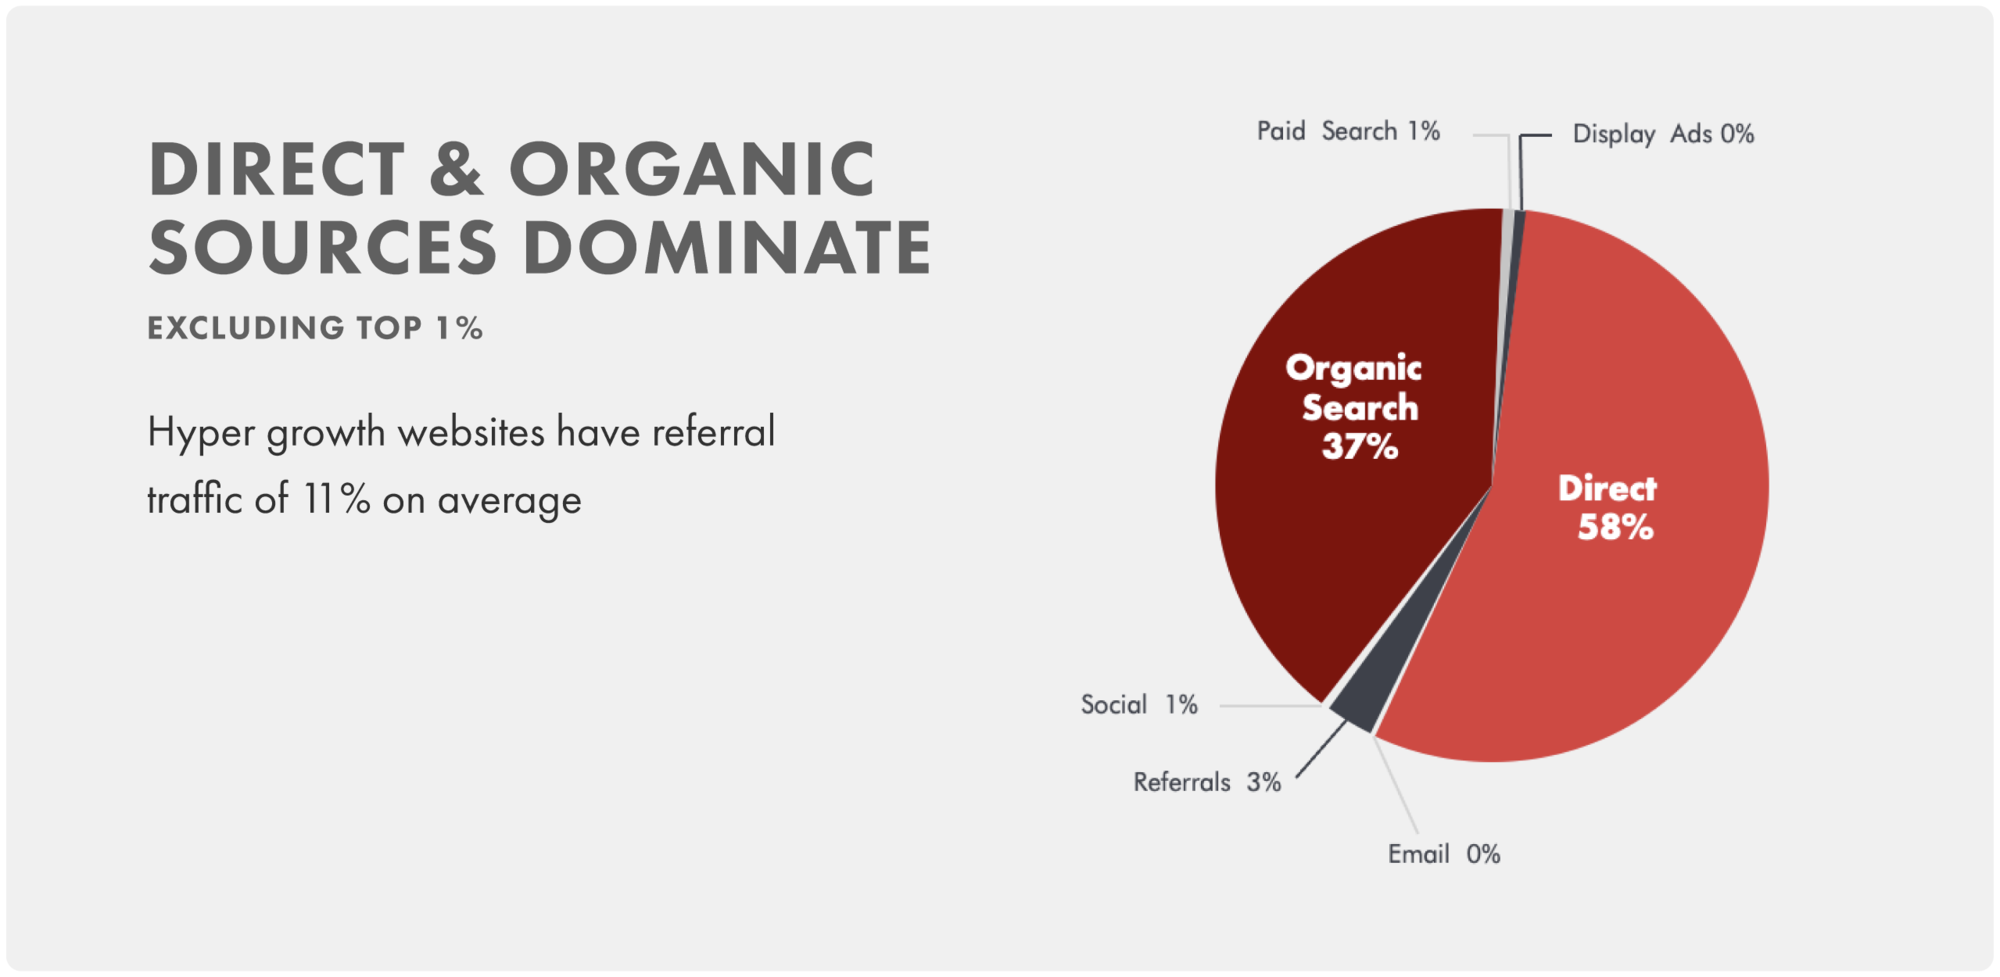
7. Traffic Sources
On average, only 3% of traffic came from referrals. However, hyper growth websites were far more reliant on this, with an impressive 11% of total traffic coming from referrals. Meanwhile, social media and display ad traffic appeared were negligible.
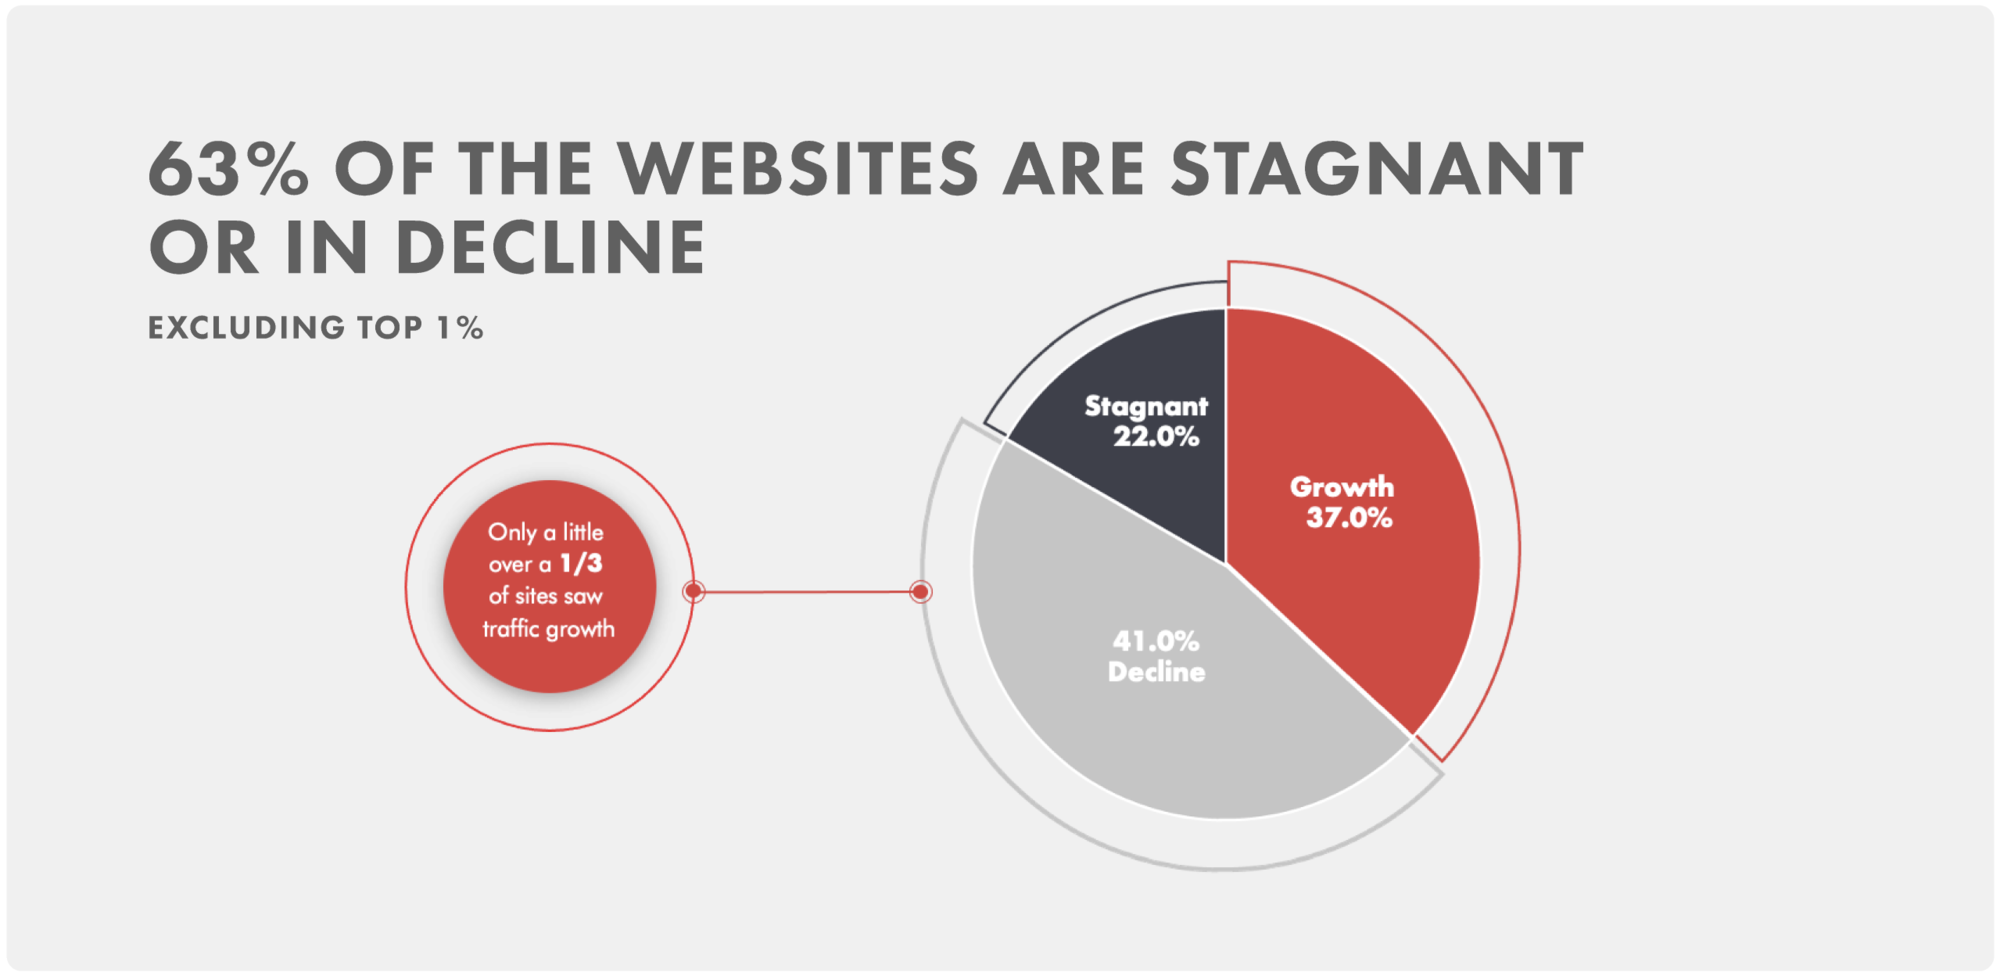
8. Growth Patterns
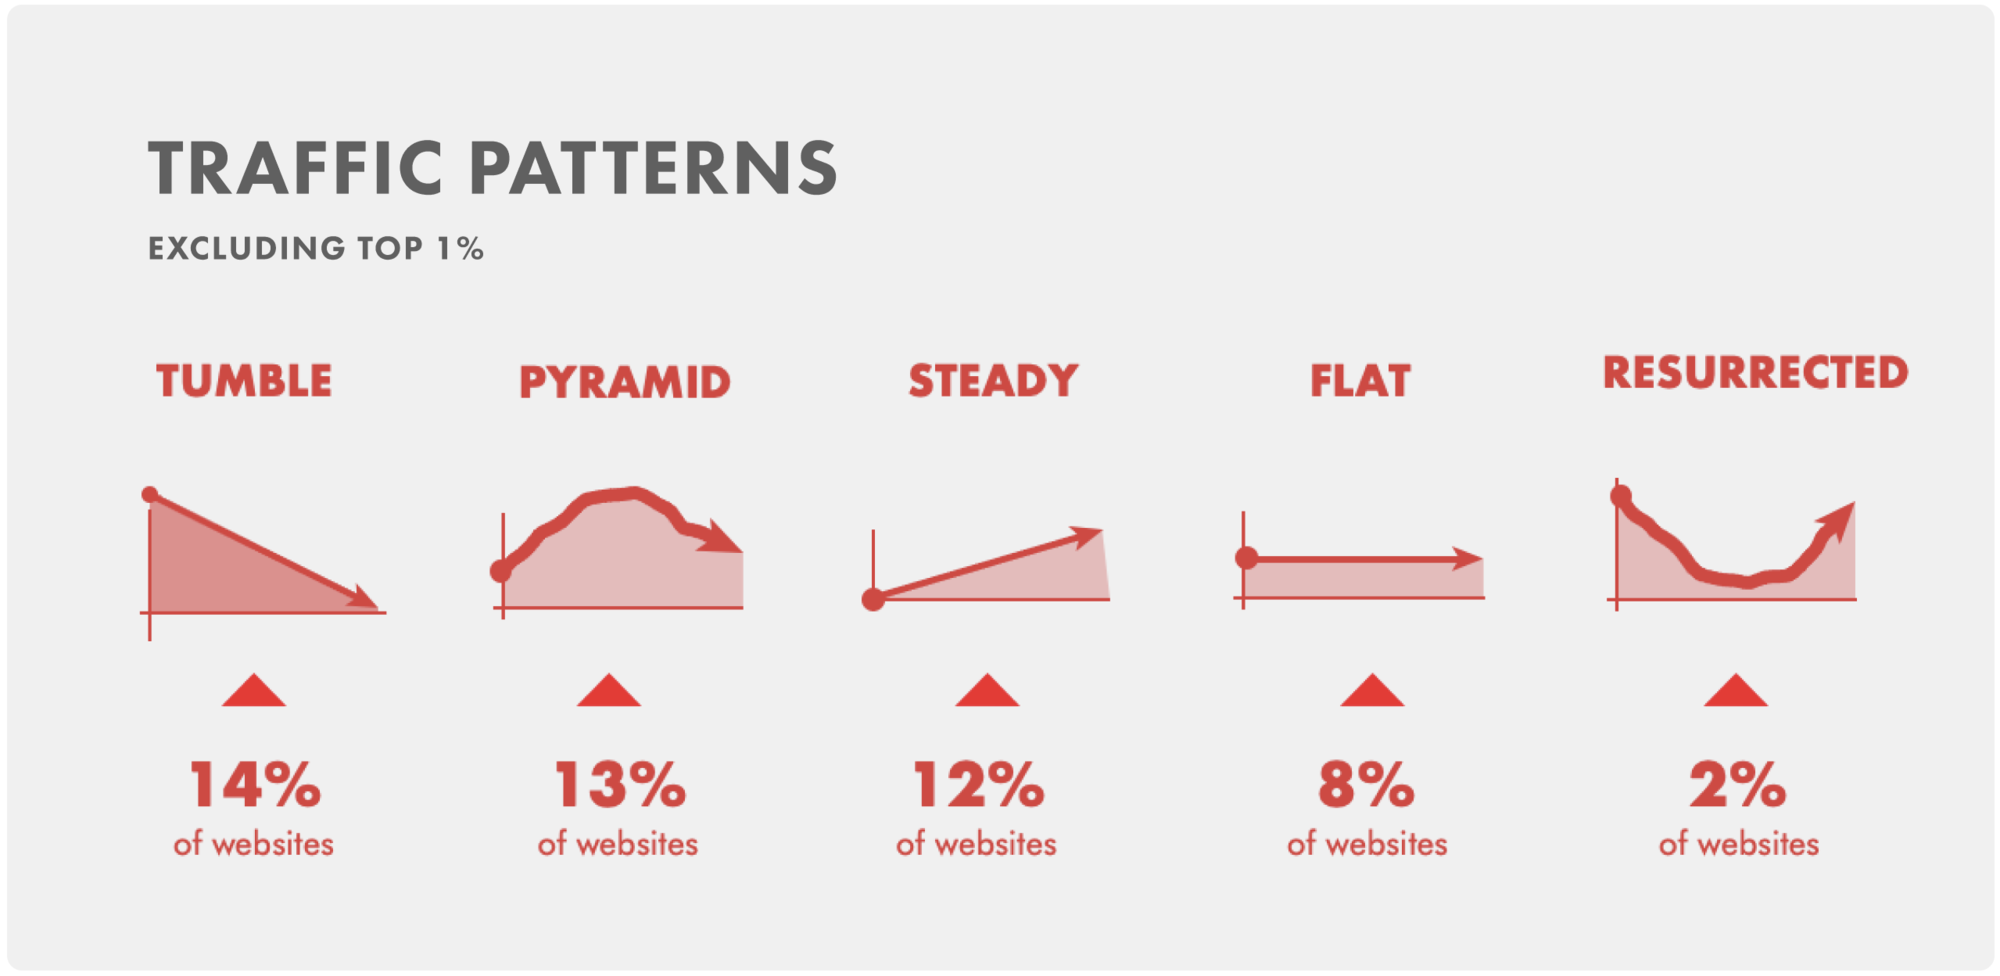
Our research shows the harsh reality that as the MarTech space continues to become increasingly cramped, achieving growth will become more and more difficult. Indeed, we found that only a third of the websites grew their traffic.
Finally, we identified and categorised the following 5 different traffic patterns.