How often do you check your phone throughout the day? We’ll give you the number – at least 144 times per day.
But what’s everyone doing on their phone? Well, users spend 88% of their time on apps, which is super encouraging for anyone who plans on creating an app but is hesitant if it's the right time.
At Kurve, we’ve used mobile app marketing strategies to turbocharge our client’s growth. Our work shows that people are using mobile apps more than ever before, and this blog will add numbers to this claim. From app users and behavior to revenue and marketing, we will dive deeper into this multi-billion dollar industry, sharing valuable insights for app developers, entrepreneurs, and digital marketers.
Let’s get started.
| Table Of Contents: |
Key Statistics
- More than 2.87 million apps are available to download on the Google Play Store and Apple App Store. (1)
- On average, a smartphone user typically has between 60 and 90 apps installed on their device. (1)
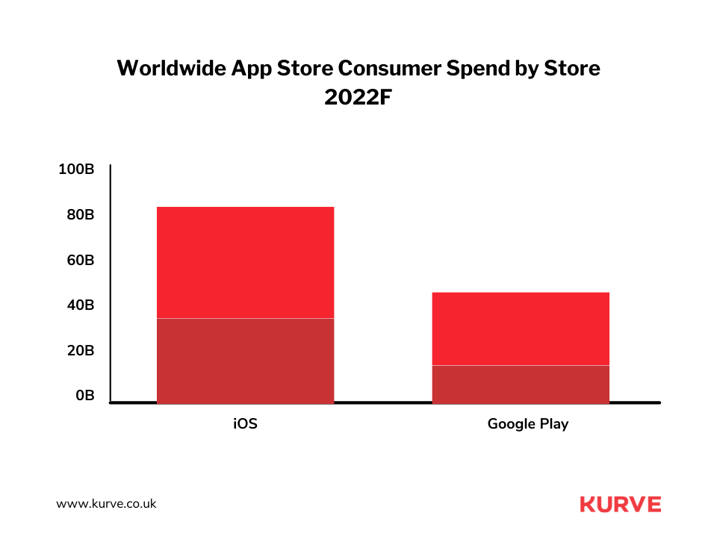
- The Apple App Store boasts a collection of over 2 million apps catering to iOS users. In comparison, the Google Play Store offers a selection of 2.56 million apps for those using Android devices. (2)
- It is expected that by the year 2023, mobile apps will generate revenue exceeding $935 billion. (3)
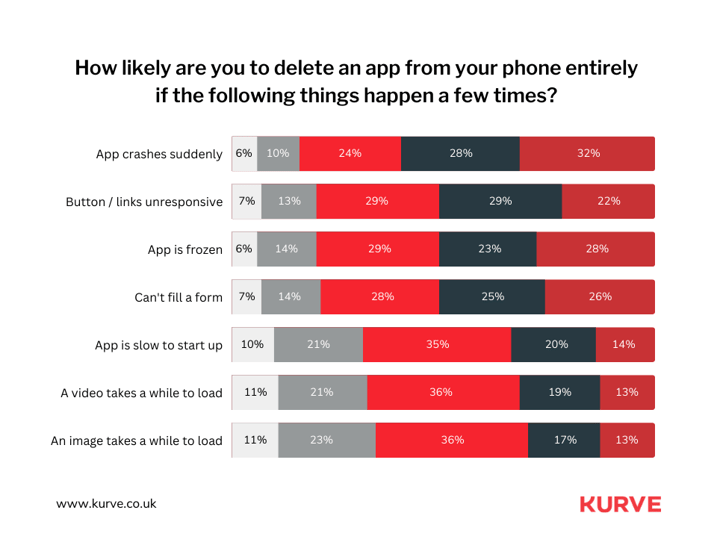
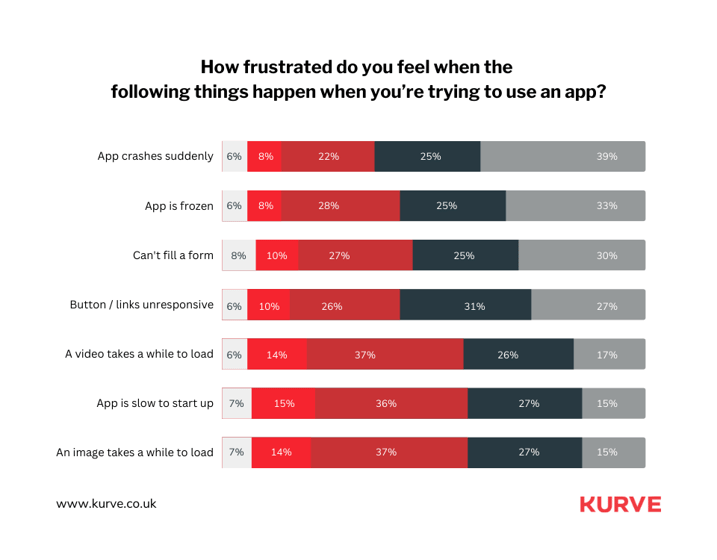
- 60% of app users will uninstall an app if it experiences multiple crashes. (4)
- The typical user switches between 9 applications on a daily basis and interacts with 30 different apps within a month. (3)
- There are approximately 6.3 billion smartphone users and 5.18 billion internet users. (1)
- More than 85% of Americans allocate their time to using their smartphones. (3)
- The average American checks their phone roughly every 12 minutes, leading to a daily media consumption exceeding 3.1 hours. (5)
- In 2022, OTT (Over-the-Top) applications achieved the top position in download numbers and consumer expenditure. These apps constituted 16% of the total spending on in-app subscriptions and purchases, comprising 4% of total app downloads. (20)
- Consumers spent nearly 110 billion hours on shopping apps in 2022. (20)
- Nearly half of people accounter performance issues in an app daily (4)
General Facts
Apps have become integrated into our lives, with many of us using them daily to shop, read, play, communicate or entertain ourselves. It can be challenging to illustrate just how impactful they are. The statistics below help highlight the relevance of these applications in our lives and provide a foundation for the overall understanding of app download statistics.
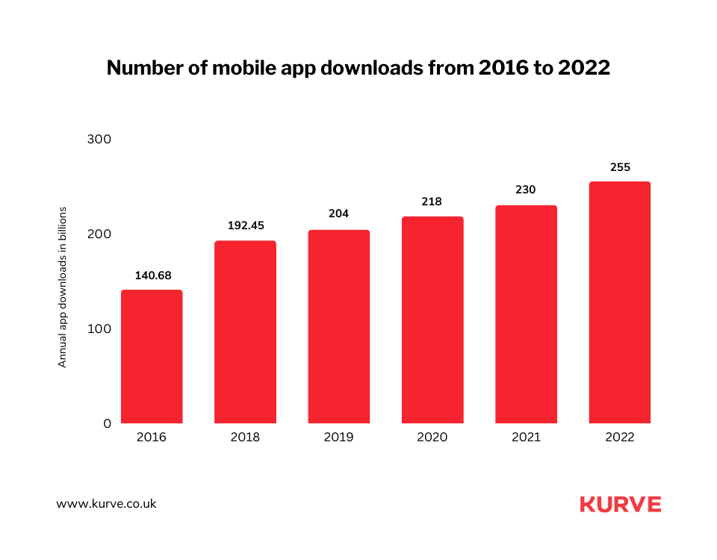
- From 2019 to 2020, daily app downloads exceeded 250 million. Over the five-year interval from 2016 to 2021, global app downloads saw a growth of 63.5% on a yearly basis. (6)
- Mobile game downloads experienced a 0.5% increase in 2022, reaching 55.6 billion, following a 1.4% decline in 2021. (2)
- China leads in total app downloads, attributed not only to its extensive smartphone user base but also to the significant downloads per capita in the country. (2)
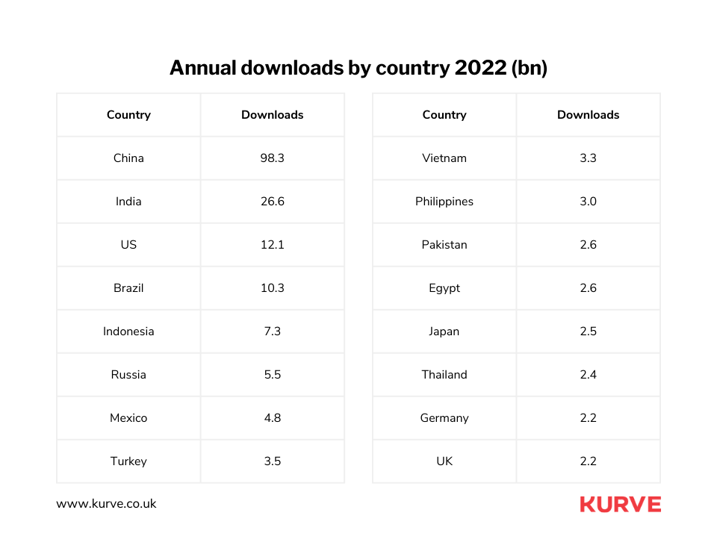
- India is the fastest-growing market for app downloads globally, boasting a remarkable 200% growth rate. (7)
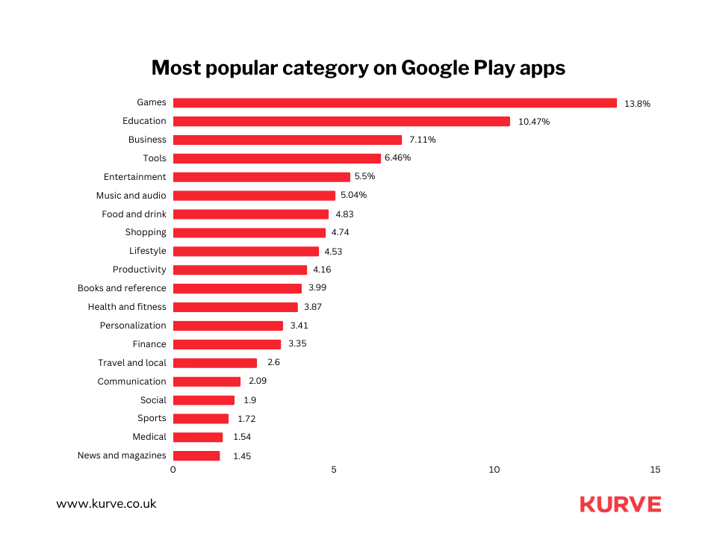
- Gaming is the most popular category on Google Play apps. (8)
- TikTok (672M) is the most downloaded app worldwide, followed by Instagram (548M), Whatsapp (424M) and Capcut (357M). (9)
%20is%20the%20most%20downloaded%20app%20worldwide%2c%20followed%20by%20Instagram%20(548M).png?width=717&height=560&name=TikTok%20(672M)%20is%20the%20most%20downloaded%20app%20worldwide%2c%20followed%20by%20Instagram%20(548M).png)
- In 2022, Google Play app downloads decreased by 2.6%, dropping from 64.6 billion to 62.9 billion downloads. (2)
- In 2022, iOS users downloaded around 600 million more apps compared to 2021, reaching a total that matched the app downloads recorded in 2020. (2)
- For app users, there's nothing more aggravating than the sudden and unexpected crashing of their app.(4)
Revenue and Marketing Statistics
Consumer time and transactions in apps are intertwined. From gaming to retail to fintech, brands must proactively invest in building a robust app that makes the most of user attention to beat the competition in the market and find monetization opportunities.
- Freemium apps generate 98% of global Google Play revenue. (11)
- In 2022, consumers expended $129 billion on in-app purchases. (12)
- Mobile apps are expected to generate over $935 billion in revenue in 2023. (13)
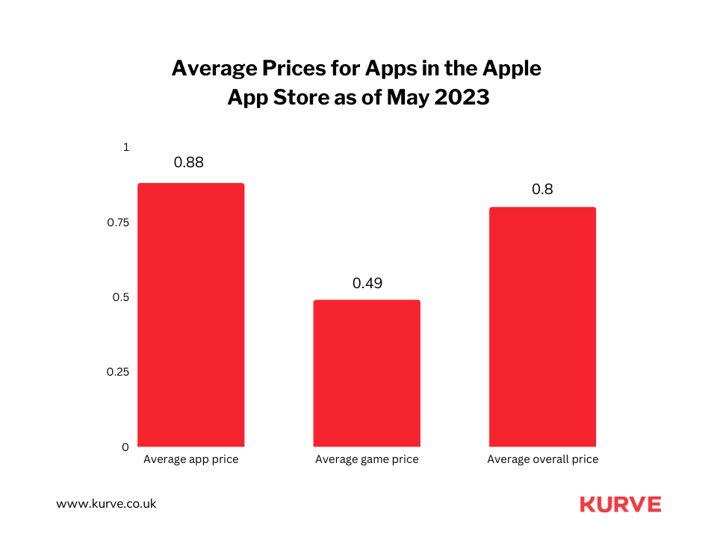
- In May 2023, it was discovered that the typical cost of an iOS gaming app within the Apple App Store stood at $0.49, while the average price for apps in general reached about $0.90. The combined average for both apps and games was $0.80. (14)
- 42% of small businesses have their own mobile app. (15)
- 83% of B2B marketers say mobile apps are important to content marketing. (16)
- App Store spending was over $167 billion in 2022. (20)
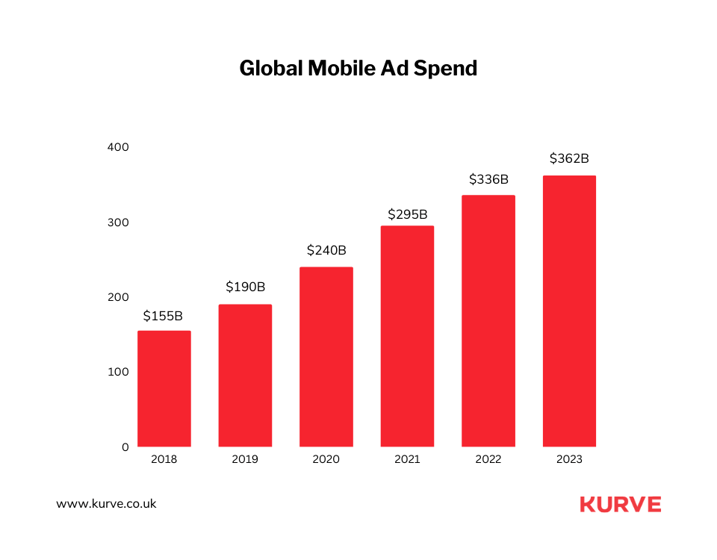
- The total mobile ad spent was $336 billion in 2022 and is set to hit $362B in 2023. (20)
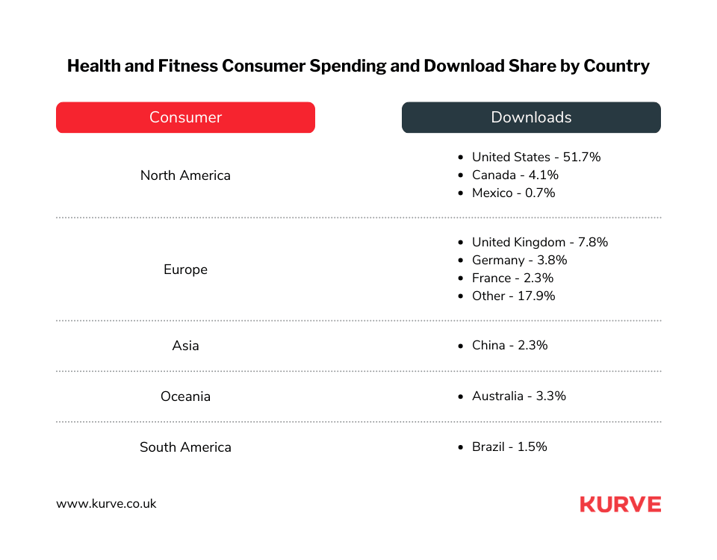
- Over 50% of consumer spending in the Health & Fitness category originates from the United States. (20)
- With the reopening of borders, language learning apps are experiencing a year-over-year growth of 31% on a global scale. (20)
- Advertising accounts for $2 out of every $3 spent on mobile. (21)
App Users and Behaviors
Mobile app usage has been trending upward for many years, and all signs point to continued growth. Global consumer spending has dropped by 2%, but downloads and time spent grew by 11% and 9%, respectively. (20). Here are more stats on app users' trends and preferences that you can refer to.
- Amazon is considered the most essential mobile app by nearly 35% of millennials, followed by Gmail at 30% and Facebook at 29%. (17)
- 25% of apps downloaded by mobile app users worldwide were used only once after installation. (18)
- As of July 2018, just 65.7% of users in the United States had at least one gaming app installed on their smartphones. (19)
- WeChat (19.5%), TikTok (17%), and Youtube (12.7%) account for 50% of the time spent. (20)
%2c%20TikTok%20(17%25)%2c%20and%20Youtube%20(12.7%25)%20account%20for%2050%25%20of%20the%20time%20spent.%20(20).png?width=717&height=560&name=WeChat%20(19.5%25)%2c%20TikTok%20(17%25)%2c%20and%20Youtube%20(12.7%25)%20account%20for%2050%25%20of%20the%20time%20spent.%20(20).png)
- 62% of smartphone users opt not to download an app to complete a transaction. (3)
- A quarter of smartphone users uninstall apps due to insufficient storage space. (3)
- 71% of app users churn after three months (3)
- There are 255 billion new app downloads in 2022. A whopping 485k apps were downloaded per minute last year. (20)
- Users spend 5 hours daily on mobile, one-third of their working hours. (20)
- Games took the biggest hit in 2022, representing a demand for more ‘need-to-have’ services. Non-gaming apps have seen strong growth despite economic headwinds.
- In 2022, a total of 1,419 apps and games managed to generate more than $10 million in annual revenue. 224 apps exceeded the impressive milestone of $100 million in annual earnings, and an elite group of 10 apps and games achieved annual revenue surpassing the remarkable $1 billion mark. (20)
- Gen Z demonstrates a strong dedication to video content, user-generated content, and mindfulness applications. (20)
- On Black Friday, Amazon attracted a larger number of active users than Walmart and Target combined. (20)
- The total time spent on social apps worldwide will exceed 2 trillion hours in 2022. (20)
- More than half (56.9%) of Americans are addicted to their cell phones. (22)
%20of%20Americans%20are%20addicted%20to%20their%20cell%20phones.png?width=717&height=560&name=More%20than%20half%20(56.9%25)%20of%20Americans%20are%20addicted%20to%20their%20cell%20phones.png)
Maximize the Benefits of Mobile Apps
Mobile apps are a multi-billion-dollar industry worldwide, and competition is fierce.
The consistent year-on-year growth in downloads signifies the app economy's vitality. More significantly, user behaviors underscore the importance of delivering user-friendly, valuable experiences to retain and engage audiences. Staying attuned to these statistics – and acting on the insights – is essential for developers and businesses to develop and fine-tune their mobile app marketing strategies and thrive in this ever-evolving mobile app ecosystem.
If you want to stay ahead of the millions of other apps on the market, contact Kurve today.
Resources
- Mobile App Download Statistics & Usage Statistics (2023) (Buildfire)
- App Download Data (2023) (Business of apps)
- 40 Fascinating Mobile App Industry Statistics [2023]: The Success Of Mobile Apps In The U.S. (Zippia)
- The State of Mobile Experience (Embrace)
- 55+ Jaw-Dropping App Usage Statistics in 2023 [Infographic] (TechJury)
- Number of mobile app downloads worldwide from 2016 to 2022 (Statista)
- With about 200% growth, India is the fastest-growing market for app downloads in the world (Entracker)
- Most popular Google Play app categories as of 3rd quarter 2022, by share of available apps (Statista)
- Leading mobile apps worldwide in 2022 by downloads (Statista)
- Google Play Store Statistics (2023) (Business of apps)
- Freemium apps account for 98 percent of worldwide Google Play revenue (TheVerge)
- Data.ai: consumers spent $129B on in-app purchases in 2022 (VentureBeat)
- Revenue of mobile apps worldwide 2019-2027, by segment (Statista)
- Average prices for apps in the Apple App Store as of May 2023 (Statista)
- 42% of Small Businesses Plan to Build a Mobile App in the Future, Presenting a New Opportunity to Connect with Customers (Clutch)
- Importance Of Mobile Apps To B2B Content Marketers, January 2015 (e-strategy trends)
- 5 Interesting Facts About Millennials’ Mobile App Usage from “The 2017 U.S. Mobile App Report” (Comscore)
- Percentage of mobile apps that have been used only once from 2010 to 2019 (Statista)
- 55+ Jaw-Dropping App Usage Statistics in 2023 [Infographic] (TechJury)
- State of Mobile 2023 (Data.ai)
- Advertising Drives $2 Out of Every $3 Spent on Mobile (Data.ai)
- 2023 Cell Phone Usage Statistics: Mornings Are for Notifications (Reviews.org)