All businesses run on numbers, and so do mobile apps.
While a business tracks sales and feedback, apps rely on KPIs (Key Performance Indicators) and metrics. These are the vital signs of your app. They signal if it's healthy, if users love it, or if it needs a tune-up.
Why are KPIs and metrics so crucial to measure mobile app performance? They're the roadmap to success, showing you where to focus for growth. At Kurve, we lean heavily on these numbers in our Mobile App Marketing. We help app owners like you navigate this roadmap.
Stick around, and we'll walk you through the key KPIs and metrics your app must consider.
App Engagement KPIs
We often think of cool designs or fancy features when discussing mobile apps. But behind the scenes, the real magic is understanding you, the user. How do you interact with an app? What makes you come back again and again?
Engagement KPIs are our window into your world. They tell us what you love, what you might not care for, and where you might want a little more sparkle. Think of them as signposts guiding the way to a better app experience.
Have you heard of the Sweatcoin project? We used these very KPIs to craft an experience users adore. So, as we unpack these key indicators, imagine their possibilities for your app's journey.
Session length, depth, and interval
Session length represents the time a user dedicates to our app in a single interaction. Logically, a more extended session suggests that users find tangible value within the app's confines.
Session depth shines a light on the extent of user engagement within specific features. Deeper sessions mean users aren't glancing; they're diving into various functionalities, extracting the value we aim to deliver.
But it's not only about depth and length. The session interval, which denotes the time between individual user sessions, provides insights into app habituation. A shortened interval? It signifies users regularly turn to the app, marking its inherent value in their digital routine.
At Kurve, we recognize the weight of these metrics in decoding user behaviors. For instance, rapid navigation through numerous screens could highlight potential issues in discoverability or navigation. Addressing such nuances can uplift the user experience.
Average screens per visit
Understanding the user journey within an app becomes pivotal when considering the average screens a user interacts with during one visit. It's like piecing together a narrative of their experience.
Yet, high screen counts can be double-edged. On one side, it might suggest extensive exploration. On the flip side, it could indicate users feeling lost or struggling to locate desired information. The key lies in interpretation and context.
In our pursuits at Kurve, the underlying philosophy is straightforward. Engagement isn't about the numbers; it's about establishing meaningful connections. Enhancing UI/UX, integrating feedback mechanisms and analyzing user pathways can optimize the average screens per visit, boosting user satisfaction.
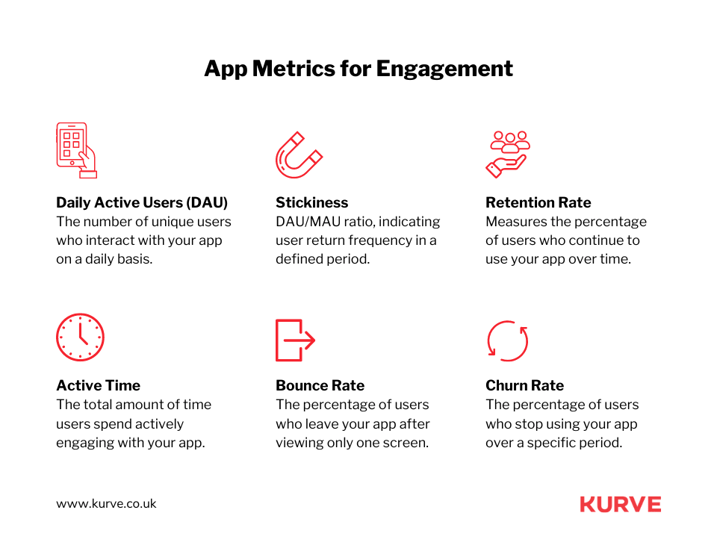
Daily and monthly active users
When measuring app vitality, Daily Active Users (DAU) and Monthly Active Users (MAU) stand at the forefront of mobile app performance. DAU counts the unique users who engage with your app daily, whereas MAU offers an extended view by measuring individual users over a month.
Why are these figures pivotal? They indicate the pulse of an app's usage and appeal. A steady or increasing DAU or MAU reflects consistent user interest. It shows us that the app meets user expectations and fulfills its intended purpose.
Yet, it's vital to approach these metrics with a discerning eye. Sure, occasional marketing campaigns can temporarily boost these figures. The real goal? Achieving sustainable and organic user engagement. This is why a strategic approach emphasizing comprehensive app strategies is essential.
Stickiness ratio
Stickiness is quantified through the stickiness ratio. This metric gauges how frequently users revisit your app. Calculated as (DAU/MAU) x 100%, it demonstrates user retention.
A high stickiness ratio implies users find consistent value in your app, making repeated visits. A low ratio signals potential retention issues that need addressing.
The aim is not fleeting attention but sustained loyalty. Understanding and optimizing this ratio can guide enhancements, ensuring users find your app indispensable.
Churn rate
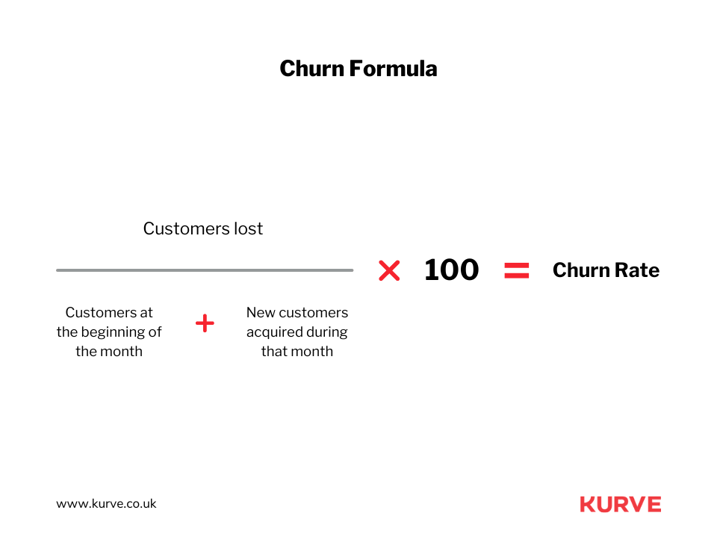
The churn rate is a pivotal metric for anyone serious about app success. It measures the percentage of users who stop using your app within a given timeframe. While gaining new users is essential, retaining existing ones is even more crucial—and the churn rate reveals where you stand.
A rising churn rate signals issues. The user experience may not be up to par, or there may be a more competitive solution in the market. It's our job to decode the underlying reasons and strategize solutions. Delve deep, survey departing users, and improve based on feedback.
Remember, each user retained equates to a reduced cost in marketing spend for new user acquisition. Plus, loyal users often become brand advocates. Thus, reducing the churn rate isn't just about holding onto users—it's about solidifying your app's position in the market.
Retention rate
Contrary to churn, the retention rate focuses on the positives: the percentage of users who continue to use your app over time. Tracking retention provides a clear lens into how valuable and meaningful users find your app in their daily lives.
It's vital not only to track retention but to understand its nuances. Break it down—does a newly launched feature boost retention? Or a specific segment of users shows higher loyalty? These insights inform you about what's working and what's not.
Elevating the retention rate goes beyond mere metrics. It's about refining and enhancing your app's offerings. Users must see consistent value in return. Engage with them, roll out regular updates based on feedback, and always be in tune with their evolving needs. A high retention rate is the hallmark of a thriving, indispensable app.
Revenue Metrics
How do mobile apps make money? It's a big question. Some apps use ads, some sell things inside the app, and others charge a subscription. But how do you know if your app is making good money? That's where revenue metrics come in.
They tell a story about whether your app is on the path to big success or might need help.
It's like checking the health of your money-making machine. We will examine these crucial numbers, the big players in understanding your app's wallet. With them, you can spot what's working and what might need a tweak.
Average Revenue Per User (ARPU)
When you hear 'Average Revenue Per User' or ARPU, think of it as the pulse of your app's earning power. What does each user bring to your financial table? Simple: divide the total revenue during a specific period by the number of active users.
Why does ARPU matter? It provides a clear snapshot of user value. If ARPU grows, you're doing something right with your offerings or marketing. But if it dips, it might be a red flag. Your pricing strategy needs revisiting, or your user engagement is dwindling. Monitoring ARPU helps you make data-driven decisions and fine-tune strategies to maximize your app's potential.
Purchases
"Purchases" seems straightforward, right? It's the number of times users buy something inside your app. But there's depth here. It's about understanding what triggers those in-app purchases.
Digging deep into purchase data gives valuable insights. For example, releasing a new feature and seeing a purchase spike is a good sign. A decrease may indicate that users don't see enough value.
For app developers, tracking and analyzing purchase behavior isn't about counting coins. It's about understanding user desires and aligning your app's offerings to meet those needs. It paves the way for future innovations and ensures that your monetization strategy stays effective.
Customer Lifetime Value (CLV)
Every user that downloads and interacts with your app represents potential revenue. But not just a one-off sale or a singular interaction. Think bigger. How much value does a user bring across the entire span of their relationship with your app? That's where Customer Lifetime Value (CLV) comes into play.
CLV predicts the net profit from the entire future relationship with a customer. If you can increase CLV, you're looking at long-term profitability. It can also guide you on how much you should invest in acquiring or retaining new users. Here's the thing: if you know that a user, on average, brings in $100 over their app usage lifetime, you'll make more informed decisions on marketing spend.
The formula is simple:
(Average value of a sale) X (Number of repeat transactions) X (Average retention time).
By understanding and optimizing CLV, you focus on more than immediate gains. You're playing the long game, ensuring sustainability and growth.
Conversion Rate
'Conversion Rate' is your scoreboard. It's a percentage that tells you how many users take a desired action, be it signing up, making a purchase, or any other key performance indicator you've set. And it's crucial as both a standalone figure and a comparative metric.
Say your app launches a new feature or an update. If the conversion rate climbs post-launch, you've got a winner. If it drops, it's back to the drawing board.
But continue beyond observing the conversion rate. Why are users converting? Is it a stellar user interface? A compelling offer? If conversions are low, it's vital to identify the bottlenecks. The sign-up process may be too tedious, or the app navigation is confusing.
The conversion rate is a compass, guiding strategies and clarifying what works and doesn't. Through consistent monitoring and tweaking, apps can achieve higher conversions, driving success and profitability.
Cost Per Install (CPI)
The mobile app marketplace is bustling, and standing out in this crowd requires a great app and effective marketing. Enter the metric: Cost Per Install (CPI). CPI indicates how much you spend to get a single installation of your app through paid advertising.
Here's the catch: a lower CPI is about more than saving on advertising costs. It also means your marketing is resonating with your target audience. But, while achieving a low CPI is a worthy goal, keep quality over quantity. It's better to have fewer installs from genuinely interested users than numerous ones from people who uninstall your app soon after.
To optimize your CPI:
- Analyze which marketing channels bring the most valuable users.
- Streamline your ad content, ensuring it's targeted, relevant, and compelling.
- Remember, while CPI provides insight into your marketing campaign's efficiency, it's part of the bigger picture.
Cost Per Acquisition (CPA)
If CPI tells you the cost of getting a user to install your app, Cost Per Acquisition (CPA) takes it further. CPA tracks the cost of acquiring a user who takes a specific action within your app, be it a purchase, registration, or other significant activities.
Why is CPA critical? Because installs alone don't guarantee profitability. Many installs with minimal user interaction or purchases can drain resources if they yield returns. CPA provides a clearer picture of your return on investment.
Reducing your CPA means reaching users who see value in your app's offerings, leading to meaningful actions. Focus on improving app functionality, user experience, and value proposition. Ensure your marketing strategies align with users' needs and desires. When you strike this balance, you'll reduce CPA and pave the way for sustained app growth and profitability.
Return on Investment (ROI)
Understanding the financial return on your mobile app investment is paramount. ROI stands for Return on Investment, a metric that takes on heightened importance in the mobile app domain.
The ROI for your mobile app is the measurement of the profits made from the app relative to its development and marketing costs.
The formula is simple: ROI = (Net Profit / Cost of the Investment) x 100.
This metric indicates an app's profitability for mobile app developers and entrepreneurs. While you might see many installs and user engagement, your approach might need reevaluation if those numbers don't translate into a positive ROI.
It's crucial to note that a mobile app's ROI is about more than immediate returns. Many apps see an extended period before a positive ROI, especially if there's a significant initial investment or if the app operates on a freemium model aiming for long-term monetization.
To bolster your ROI, focus on user retention, optimize your marketing strategies, enhance in-app purchase opportunities, and continuously improve user experience. By tracking and understanding your ROI, you're better positioned to make informed decisions on where to allocate resources, which features to develop, and how to steer your marketing campaigns.
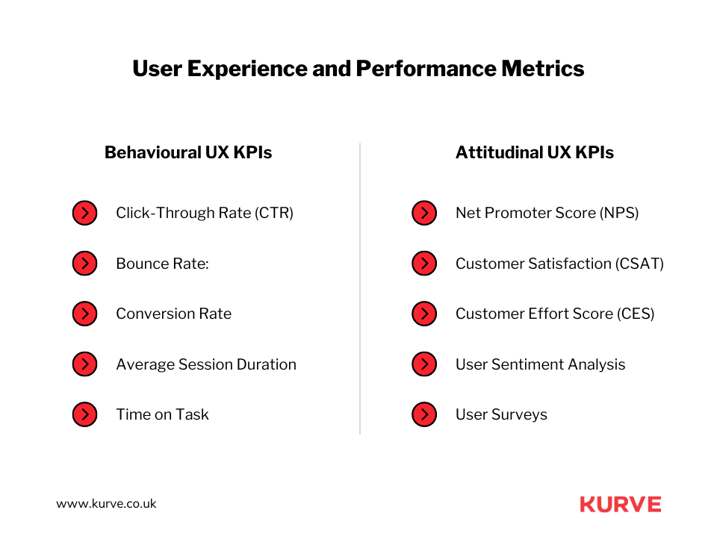
User Experience and Performance Metrics
When you develop a mobile app, your users are at the core of every design choice, every feature added, and every line of code. But how do you determine if they're having a seamless and satisfactory experience? The answers lie in user experience and performance metrics.
User experience (often called UX) encompasses a user's interaction with your app – from the design's intuitiveness to the app's response speed. Performance zeroes in on how efficiently your app operates. Together, these two aspects form the backbone of a mobile app's success or downfall.
Every tap, swipe, or pause in your app has the potential to make or break the user's experience. Hence, tracking user experience and performance metrics isn't a nicety; it's essential.
As we delve deeper, we'll take you through the critical metrics to better understand your app's standing from a user's perspective.
Load Time
Load time refers to the time it takes for your mobile app to launch after a user taps on its icon. It's a metric that may seem trivial, but its implications are profound.
Users are impatient. A delay of even a few seconds can mean the difference between a user engaging with your app or abandoning it. Anything beyond that, and you risk losing potential customers.
But why is a fast-loading app crucial? For starters, a fast load time ensures that users can access the app's features quickly, leading to instant gratification. It also communicates efficiency and robustness, suggesting the app is well-optimized and built to professional standards.
A prolonged load time leaves users questioning the app's quality. Consistently long load times can diminish user trust and satisfaction. Over time, this can decrease user retention and lower overall app ratings.
Monitoring and optimizing load time is imperative. It ensures you keep user frustration at bay and guarantees the first interaction with your app is always on a positive note.
Devices and Operating Systems (OS)
Understanding your app's performance across various devices and operating systems is paramount. Think about it: today's market is flooded with devices, each with its screen size, resolution, hardware specifics, and nuances. Add many operating system versions, and you have a veritable maze to navigate.
Why does this matter? Because every device and OS combination can uniquely interact with your app. What runs smoothly on a high-end smartphone with the latest OS might stutter or crash on an older model running a dated version. Paying attention to this metric can mean disregarding a significant chunk of your app downloads and potential user base.
Tracking and analyzing data related to the devices and OS versions used by your audience allows you to:
- Optimize Performance: Tailor your app's functionality and design to most users' devices and OS.
- Future-Proofing: Stay ahead of OS updates or changes that could impact your app's functionality.
- Maximize Reach: Ensure that even users with older devices have a seamless experience, expanding your potential audience.
- Informed Decisions: When it comes to features or fixes, understanding most devices and OS usage can prioritize development tasks.
Ignoring these metrics could lead to negative reviews from users experiencing glitches, freezes, or crashes. Ensuring your app runs efficiently across all devices and OS cements a foundation for widespread positive reception and use.
Screen Dimensions and Resolutions
A mobile application's adaptability to different screen dimensions and resolutions can influence its success.
Imagine a scenario: A user downloads your app on their new tablet after using it on their smartphone. If the app appears stretched out or distorted, or some elements don't fit the screen, that user's experience is instantly diminished. It's akin to fitting a square peg in a round hole. This isn't a minor technicality but a potential barrier to user engagement.
When your app is optimized for various screen dimensions and resolutions, it ensures that every user, regardless of their device, gets an optimal experience. Such considerations lead to higher engagement rates and better user reviews.
Further, understanding your users' most common screen sizes helps refine developmental and design strategies, ensuring you cater to the majority effectively. In the dynamic world of mobile devices, tailoring your app to fit every screen is a move towards inclusivity and broader reach.
App Crashes and Bugs
Nothing disrupts a user's experience more than unexpected crashes and pesky bugs when using a mobile app. For users, an app that frequently crashes becomes synonymous with unreliability, which can prompt them to look for alternative apps or even lead to uninstallation.
Monitoring app performance isn't only about maintaining technical health. It's about preserving users' trust in your application. Every crash report and bug log offers insights into potential weak points, allowing developers to rectify issues and enhance performance.
An uninterrupted, smooth user experience is the expected standard in today's digital age. You improve app functionality by actively addressing and minimizing crashes and bugs. Prioritizing these areas will result in better user reviews and higher user retention. Maintaining a bug-free environment will pave the way for the app's continued success and growth.
Mobile App Latency
Latency within a mobile application is the delay a user perceives between their action and the app's reaction. In the hyper-speed world of mobile usage, even split-second delays can be the difference between a user loving or loathing your app.
Mobile app latency can stem from various sources. It might be due to server issues, poor coding practices, network congestion, or inadequate resources. Regardless of the cause, high latency impacts user satisfaction. Users want quick, responsive apps. If your application doesn't deliver on this front, they'll find one that does.
The consequences of ignoring latency stretch beyond user annoyance. High latency can lead to higher bounce rates, reduced session times, and negative reviews. By monitoring and optimizing for low latency, you ensure your app responds promptly to user interactions, enhancing user experience and increasing the likelihood of positive feedback.
Data drive mobile apps
From the moment users engage with an app to the moment they leave, they leave behind valuable insights.
Throughout this guide, we've explored how to capitalize on this data:
- We need to understand how engaged users are with our app.
- We learned to track how often they visit and how long they stick around.
- We discussed how to track if our app is generating revenue and where that revenue is coming from.
Of course, it's not all about money. The technical bits matter too. We must ensure our app works smoothly on every device, doesn't crash, and loads quickly.
With all this information, what's the next step? Interpretation and action. And if you need help with how to act on this data, remember: you don't have to do it alone. Kurve's Mobile App Marketing Services is here to guide you. We can help you understand these metrics better and turn knowledge into growth for your app.